Despite watching the news and seeing various market indexes hit record highs, many people are hesitant to invest their money. In most cases, this is understandable as people are uncomfortable trading in mediums they do not fully understand. However, by gaining an understanding of some vital market indicators, you can make the trading process much less scary and potentially get an excellent return on your investments.
Several disciplines and analysis types that provide traders with a rational and informed way to make trading decisions have evolved over the last several decades. Three such disciplines have gained immense popularity in the trading and the investment community.
Today, almost all trading decisions made by traders, retail or institutional, revolve around these three disciplines. Hence, to succeed in trading the financial markets, these three disciplines are a must-know for all traders and investors.
The three ways in which you can analyze financial instruments and make informed decisions to trade them are Technical Analysis, Fundamental Analysis, and Sentiment Analysis.
While it can be argued that there are other reliable forms of analysis that can inform your decisions to trade various financial instruments and securities, however, for the most part, they can all be categorized as a branch within these three disciplines.
Now, without further ado, let us explore each of these three disciplines in some more detail.
IMPORTANT SIDENOTE: I surveyed 1500+ traders to understand how social trading impacted their trading outcomes. The results shocked my belief system! Read my latest article: ‘Exploring Social Trading: Community, Profit, and Collaboration’ for my in-depth findings through the data collected from this survey!
Table of Contents
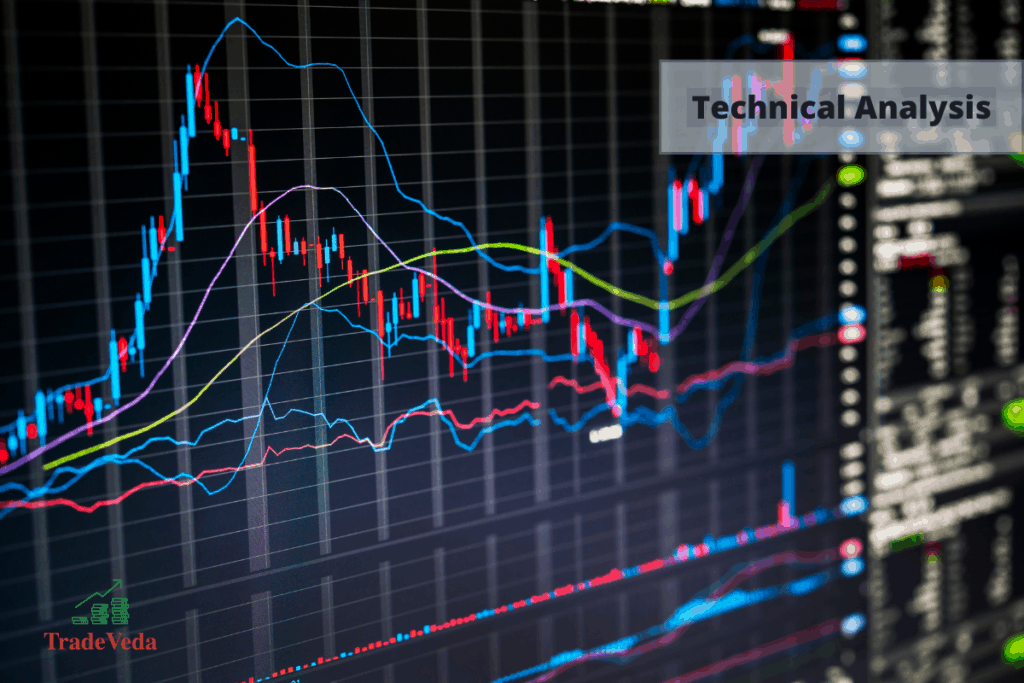
Technical Analysis
Technical analysis is a method of evaluating securities based on historical price trends and chart patterns. You can use this method to forecast the future performance of any security, as long as you have access to the historical pricing and performance data on it. Traders in all asset classes, such as – stocks, Forex, bonds, cryptocurrencies, etc., rely on Technical analysis for making informed trading decisions.
Some common statistics used in technical analysis include the volume traded and price movement. By looking into how a security has traded in the past, investors can often get short to medium term trading signals that indicate the future performance of the security.
Technical analysis differs from fundamental analysis, which looks at a financial instrument’s health and valuation through metrics such as economic demand and free cash flow, and sentiment analysis, which attempts to gauge how the opinion of the public and key influencers can drive security prices.
A technical analyst will not dig as deep into a security’s financials as a fundamental analyst would. This is because the practitioners of technical analysis assume that all fundamental and sentimental factors, that can influence the price of a financial instrument, are already baked into its price chart available to them.
Key Concepts and Branches of Technical Analysis
To make trading decisions using technical analysis, traders rely on a variety of chart types, chart patterns, and chart indicators. These tools are instrumental for technical traders in determining whether or not to buy, sell, or hold as security.
In the next few sections of this article, we will briefly discuss each of these three sub-disciplines within technical analysis.
Chart Types
Anyone who completed middle school math has experience in reading charts, which are a graphical representation of how a specified variable performs over time.
This same graphical representation is used when performing technical analysis for trading financial instruments, making the process very easy to understand for investors at all levels of experience. In fact, those traders who rely heavily on technical analysis are often referred to as “chartists,” thanks to their propensity for studying graphs when deciding on their trading plan for a security.
The following are some of the most common types of charts used in technical analysis:
- Line Chart – This is the most basic form of chart used in technical analysis. It will show a single line, linked from left to right, that either rises or falls over time, based on the performance of a given metric, such as the closing price of a stock. Think of the classic line that shows the performance of the Dow Jones Industrial Average as an example.
- Bar Chart – This offers more information for the technical analyst and is often referred to as an open-high-low-close (OHLC) chart. This will be a bar that starts at the low end of the security price for the day and extends to the high price. A horizontal hash to the left of the bar shows the open price, while a hash to the right shows the closing price.
- Candlestick Chart – This is similar to an OHLC chart and gets its name because each chart entry looks like a candle. The thick “wax” segment represents the range between the opening and closing price, while the “wicks” above and below represent the high and low. These charts are valuable when analyzing near the top and bottom of trends.
- Renko Chart – This is a simple chart that plots bricks based on whether a security price went up or down for the day. A three-day losing streak followed by a five-day winning streak will plot three red bricks going down, followed by five green bricks going up. As such, these charts look like a series of small v’s and w’s.
Chart Patterns
Technical analysts use patterns to help spot trends in the performance of a security. Patterns are used to help identify resistance levels or a price point at which an upward trending securities struggle to break through, and support levels that are price points below which downward trending securities rarely fall.
Patterns identified by technical analysts will either be classified as continuation patterns, which signal a temporary interruption in a particular trend, or a reversal pattern, which helps identify a potential reversal in the direction of a prevailing trend.
The following are some of the common continuation chart patterns used by technical analysts:
- Pennants – These are formed during the holding phase of a prevailing long term trend in which volume slows down. Within this pattern, a short term uptrend line will converge with a short term downtrend line to form a triangular point that looks like a pennant. A volume increase will then continue the prevailing trend, causing it to stand out as a brief pause.
- Flags – Flags will be constructed using two parallel trendlines in the middle of a prevailing trend. Typically, a downward sloping flag will represent a pause in a long term uptrend, and an upward sloping flag will show a pause in a long term downtrend. The flag pattern will be broken by an uptick in buying or selling volume.
- Wedges – This is another pattern that is formed by the convergence of two trend lines, with both trendlines moving in the same direction (either up or down). Like with pennants and flags, a wedge is a continuation pattern formed during a period of low trading volume, with the prevailing trend continuing once volume sees an uptick.
The following are some common reversal chart patterns used by technical analysts:
- Head and Shoulders – This gets its name because the pattern will look like a head with a couple of arms shrugging at the side. This will see a small initial peak or trough, followed by a second, larger one, with a third peak or trough mirroring the initial one. An uptrend that sees a head and shoulders pattern will likely result in a downtrend, and vice versa.
- Double Top – This occurs when an upward trending security tries to break through a resistance level, is denied, catches its breath, and is denied again at that resistance level. This forms a pattern that looks roughly like the letter M and is a likely indication of a prevailing downtrend to come.
- Double Bottom – This occurs when a downward trending security tries to break through a support level, is denied, regroups, and is denied again at that support level. This forms a pattern that looks roughly like the letter W and is a likely indication of a prevailing uptrend to come.
Chart Indicators
Technical analysts look for pattern-based, mathematical indicators in a security’s historical price and volume levels to help identify entry and exit points when trading that security. While there are several chart indicators that technical analysts use, the following are among the most popular ones:
- Moving Average Convergence-Divergence (MACD) – This shows the relationship of two moving averages of a security’s price by subtracting the 26-period exponential moving average from the 12-period exponential moving average. This results in a line that, when compared to a set signal line, can indicate a buy/sell for the technical analyst.
- Bollinger Bands – This indicator was developed in the 1980s by John Bollinger to help identify short term trends in the price of a security. It is created by plotting a predetermined number of standard deviations over a simple moving average line, with one outer band above and below this line. Under default indicator settings, the outer bands are plotted two standard deviations from the simple moving average line, and the changes in the width of indicator helps indicate the volatility in the market.
- Relative Strength Index (RSI) – This is an oscillation indicator that helps identify the speed and size of price movements. It is plotted on a scale of 0 to 100, with scores of 70 or higher indicating that the security being analyzed is overbought and scores of 30 or lower indicating that the security is oversold.
Advantages and Limitations of Technical Analysis
Technical analysis has several advantages and limitations in comparison to the other methods, the fundamental analysis and the sentiment analysis, of analyzing securities to inform trading decisions.
Listed below are some of these advantages and limitations of technical analysis that you should consider when creating your trading plan.
Advantages of Technical Analysis
- Is not overly complicated, as following the historical trends of a security is easy to understand for investors of all levels
- When employing the proverbial “buy low, sell high” strategy of trading, technical analysis is arguably the preferred method of valuation
- It can be applied to virtually every type of tradable security
- It is suitable for both long and short-term investing strategies
Limitations of Technical Analysis
- Historical data and trends are no guarantee to predict the future performance of a security
- Large groups of investors buying or selling from the technical analysis can create short-term trends that are not representative of the security’s true outlook
- There is a strong tendency to overvalue financially weak securities and undervalue financially strong securities
- Newly listed securities are nearly impossible to value using technical analysis
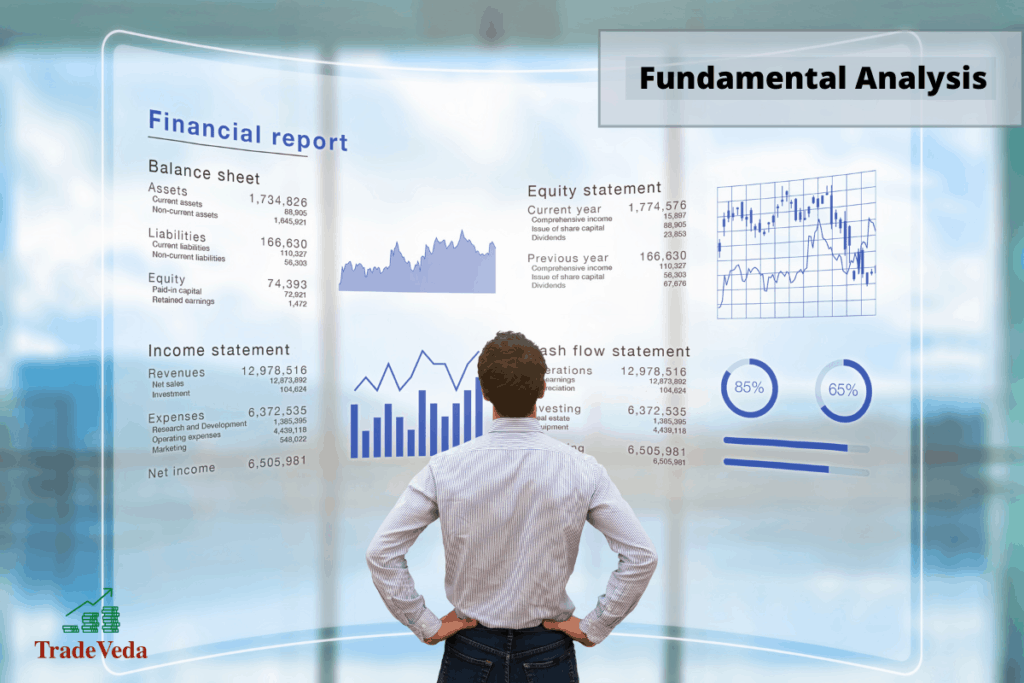
Fundamental Analysis
In trading financial instruments, fundamental analysis is a method for assigning a fair market value to a particular security based on market indicators, industry standards, and corporate health. In this analysis method, by using a combination of macro and microeconomic factors to come to a fair value for a security’s price, investors can decide if a security is over or undervalued at its current level of trading.
Fundamental analysis differs from technical analysis in that it does not pay attention to trends in a security’s historical trading price or volumes, and from sentiment analysis in that it does not try to measure the opinion of the public or market’s key influencers.
Fundamental Analysis in Important Markets
One of the critical points to remember when performing fundamental analysis is that the key “fundamentals” to assess will vary from market to market. For example, one market may require the trader to look heavily into interest rates and debt-to-earnings ratios, while the other may be more concerned with free cash flow and gross margin.
Two of the most heavily traded markets for U.S. investors are the foreign exchange (Forex) market and the domestic stock market. Therefore, it is critical to understand how to perform fundamental analysis in each of these two markets properly.
Fundamental Analysis in Forex Market
The Forex market focuses on the conversion of one currency form such as the United States dollar (USD) into other currency forms, such as the Euro or the Japanese Yen. As the price of a currency is based on factors of supply and demand, it can be pegged to another foreign currency or basket of other foreign currencies.
The following factors should be considered when performing fundamental analysis in the Forex market, as any of these can strengthen or weaken a currency:
- Inflation and Interest Rates – The rate at which prices are rising in a foreign country can have a significant impact on the value of its currency in comparison to another currency. In addition, interest rates are closely tied to inflation, so the trader needs to understand how these two fickle concepts can sway the conversion rate of a currency.
- Consumer Spending and Economic Growth – Fundamental analysts delving into the Forex market will need to look at factors such as unemployment, job creation data, median income, and discretionary spending when assessing a currency’s potential for growth.
- Foreign Investment – Higher interest rates will likely attract foreign investors to a country, which can help strengthen the price of a currency over time.
- Geopolitical Tensions – Fundamental analysts of Forex markets need to carefully follow the news and track any data that may indicate the level of amiability between nations.
Fundamental Analysis in the Stock Market
Fundamental analysis for the stock market will rely on very different factors from that of the Forex market, and will substantially focus on a corporation’s financial statements required to perform an assessment. The following factors, among many others, should be considered when conducting fundamental analysis in the stock market:
- Revenue – This measures the amount of sales dollars that a publicly-traded company makes for a given period.
- Return on Equity – This will take all a company’s assets and subtract all liabilities, and then measure profitability against shareholder’s equity.
- Profit Margin – This is the percent by which the revenue from sales exceeds company expenses.
- Free Cash Flow – This is the amount of cash that a business generates and has available to distribute to stakeholders.
Advantages and Limitations of Fundamental Analysis
Fundamental analysis has several advantages and limitations in comparison to the other methods, technical analysis and sentiment analysis, of analyzing securities for trading.
Listed below are some of these advantages and limitations of fundamental analysis that you should consider when creating your trading plan.
Advantages of Fundamental Analysis
- Investing in securities with strong fundamentals minimizes risk and volatility
- Is excellent for long term investments, as securities with strong fundamentals are likely to provide steady returns over time
- Experienced investors have been using fundamental analysis when choosing investments since the inception of markets
- Can help pinpoint a fair price point for young companies and securities
Limitations of Fundamental Analysis
- Can be very nuanced and complicated for a casual trader to understand without significant research
- Fundamentals are likely to be different for different markets and investment instruments
- May be harder to locate, compute, and/or interpret the constituent data necessary for sound fundamental analysis
- As the world changes and more entities are comfortable with debt, relying on fundamental analysis may be dated and/or too conservative for some markets
Sentiment Analysis
Sentiment analysis is a measure of how investors feel about a given market. It can even include the current public mood regarding the trading of a particular asset class and can be heavily influenced by the opinion of key figures.

Sentiment analysis differs from technical analysis, which focuses on historical trends of an asset class, and fundamental analysis, which looks into detailed financial metrics that drive a security’s fair market value. Sentiment analysis also tends to be harder to quantify than the other analysis types, as something as simple as a tweet from the President can drastically alter sentiment.
Sentiment Analysis in Important Markets
Much like fundamental analysis, sentiment analysis, and the tools for monitoring sentiment, can vary based on the market in which trading takes place.
Sentiment Analysis in a Forex Market
Forex sentiment analysis can help identify the position of Forex traders to help you decide your own strategy. The following are some tools used in performing Forex sentiment analysis:
- Broker Client Sentiment Reports – Most brokers publish a daily sentiment report reflecting trading activity across various currency pairs on their platform. This indicator gives an aggregate of long (the expectation a purchase will rise in value) and short (the expectation a holding will decline in value) client trades to help generate an understanding of how the Forex market is feeling about a currency.
- Commitment of Traders (COC) Report – This compilation is published weekly and gives a record of the submitted trades in commodity markets, painting a picture of how committed foreign investors are to a particular asset class.
Sentiment Analysis in the Stock Market
While there is no one way to put a finger on the exact public sentiment toward the stock market, there are several indicators that can help traders get an idea of how the market views a specific security:
- VIX Index – This is sometimes called the “fear index,” as it aims to measure the amount of fear in the market. It measures the volatility in stock options, which investors typically use to hedge and protect their investments, so higher option amounts indicate greater fear.
- Put/Call Ratio – This specifically tracks stock options. A high ratio of “puts” indicates that investors are fearful, while higher call ratios signal that investors are willing to take on more risk.
- Safe Haven Assets – Increased investment levels in U.S. treasuries and precious metals indicate that traders are fearful of volatility in the stock market.
Advantages and Limitations of Sentiment Analysis
Sentiment analysis has several advantages and limitations in comparison to the other methods, technical analysis and fundamental analysis, of analyzing securities for trading.
Listed below are some of these advantages and limitations of Sentiment analysis that you should consider when creating your trading plan.
Advantages of Sentiment Analysis
- Can be extremely relevant given the 24/7 news cycle and the prevalence of social media in swaying opinions
- Very useful for day traders and short term investors that want a quick profit or to avoid sharp declines
- Often does not require as much mathematical or statistical prowess to understand
Limitations of Sentiment Analysis
- Very difficult to measure in an objective, quantifiable manner
- To be most effective it requires near around-the-clock monitoring of investor and public mood
- Extreme volatility is nearly impossible to avoid
Author’s Recommendations: Top Trading and Investment Resources To Consider
Before concluding this article, I wanted to share few trading and investment resources that I have vetted, with the help of 50+ consistently profitable traders, for you. I am confident that you will greatly benefit in your trading journey by considering one or more of these resources.
- Roadmap to Becoming a Consistently Profitable Trader: I surveyed 5000+ traders (and interviewed 50+ profitable traders) to create the best possible step by step trading guide for you. Read my article: ‘7 Proven Steps To Profitable Trading’ to learn about my findings from surveying 5000+ traders, and to learn how these learnings can be leveraged to your advantage.
- Best Broker For Trading Success: I reviewed 15+ brokers and discussed my findings with 50+ consistently profitable traders. Post all that assessment, the best all round broker that our collective minds picked was M1 Finance. If you are looking to open a brokerage account, choose M1 Finance. You just cannot go wrong with it! Click Here To Sign Up for M1 Finance Today!
- Best Trading Courses You Can Take For Free (or at extremely low cost): I reviewed 30+ trading courses to recommend you the best resource, and found Trading Strategies in Emerging Markets Specialization on Coursera to beat every other course on the market. Plus, if you complete this course within 7 days, it will cost you nothing and will be absolutely free! Click Here To Sign Up Today! (If you don’t find this course valuable, you can cancel anytime within the 7 days trial period and pay nothing.)
- Best Passive Investment Platform For Exponential (Potentially) Returns: By enabling passive investments into a Bitcoin ETF, Acorns gives you the best opportunity to make exponential returns on your passive investments. Plus, Acorns is currently offering a $15 bonus for simply singing up to their platform – so that is one opportunity you don’t want to miss! (assuming you are interested in this platform). Click Here To Get $15 Bonus By Signing Up For Acorns Today! (It will take you less than 5 mins to sign up, and it is totally worth it.)
Conclusion
When considering a securities trade, investors may use either technical, fundamental, or sentiment analysis. While every trader will have an analysis form that he or she prefers, it is prudent to pay attention to all three to get the best feel for when to buy, sell, or hold securities.
BEFORE YOU GO: Don’t forget to check out my latest article – ‘Exploring Social Trading: Community, Profit, and Collaboration’. I surveyed 1500+ traders to identify the impact social trading can have on your trading performance, and shared all my findings in this article. No matter where you are in your trading journey today, I am confident that you will find this article helpful!
Affiliate Disclosure: We participate in several affiliate programs and may be compensated if you make a purchase using our referral link, at no additional cost to you. You can, however, trust the integrity of our recommendation. Affiliate programs exist even for products that we are not recommending. We only choose to recommend you the products that we actually believe in.
Recent Posts
Exploring Social Trading: Community, Profit, and Collaboration
Have you ever wondered about the potential of social trading? Well, that curiosity led me on a fascinating journey of surveying over 1500 traders. The aim? To understand if being part of a trading...
Ah, wine investment! A tantalizing topic that piques the curiosity of many. A complex, yet alluring world where passions and profits intertwine. But, is it a good idea? In this article, we'll uncork...
