Trading securities can be a very lucrative pursuit, and in the quest to discover a fool-proof way to predict future security prices, various ways to read stock prices have been developed. One of these theories of security price fluctuation is harmonic patterns, in which security prices can be read in wavelengths, similar to sound waves. One such harmonic pattern that securities traders look for is the bat pattern.
What is the bat pattern in trading? The bat pattern is a specific geometric pattern of security price over time that involves five different price points, with a change in between each. It consists of retracing the price that is intended to let you know when a trend is continuing, to allow you to enter the market at a good price. There are both bearish and bullish versions of the bat pattern, and it applies to all types of securities, not just stocks.
The bat pattern can be used by securities traders to provide a reasonable price point for entering a security. The bat pattern is one of the four patterns found in harmonic trading. Harmonic trading holds that price movement can be broken into specific waves that can be analyzed for a pattern, ultimately to allow a trader to identify the start of another trend and allowing them to enter at an advantageous price. Harmonic trading utilizes Fibonacci numbers, which are specific ratios that technical traders use to determine when a particular pattern is present.
IMPORTANT SIDENOTE: I surveyed 1500+ traders to understand how social trading impacted their trading outcomes. The results shocked my belief system! Read my latest article: ‘Exploring Social Trading: Community, Profit, and Collaboration’ for my in-depth findings through the data collected from this survey!
Table of Contents
What is the Bat Pattern?
The bat pattern is a pattern of security prices over a specific period. The theory behind the bat pattern is that it provides a trader a good basis for predicting the future security price, as it will move in that same pattern again. You can see an example bat pattern in the figure below. This pattern indicates that after point D, the price will rise again. As you can see, the points with the accompanying lines resemble a bat, hence the name.

What Are the Components of a Bat Pattern?
A bat pattern has several characteristics that clue traders into its presence. It will have four distinct legs of price retracement. The named points on the example figure indicate the floor and the ceiling prices (commonly called a swing high and swing low), the endpoint of the trend before it retraces itself.
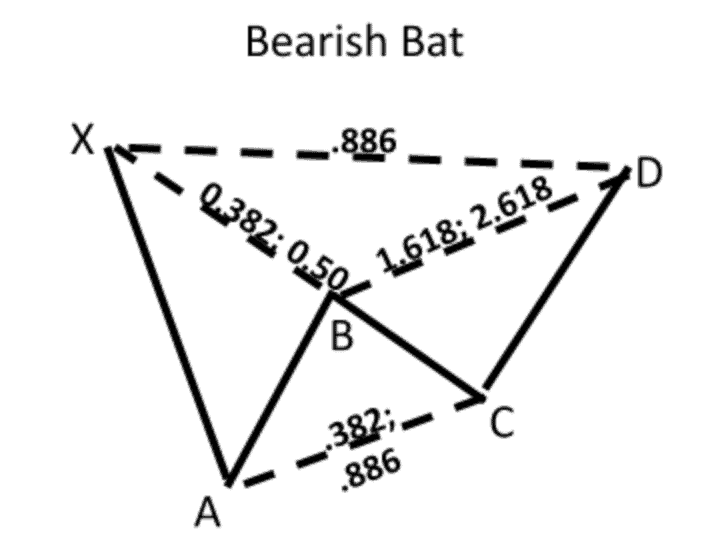
The cycle repeats itself to form two more legs. In the figure above, the bat pattern has the following four legs: XA, AB, BC, and CD. However, a bat pattern has the specific ratios shown above for price retracement. Technical traders utilize the Fibonacci series to identify when a bat pattern is present.
What is the Fibonacci Series?
Fibonacci ratios are numbers that are used to predict good stock price entry levels, at least in the field of harmonic trading. For the bat pattern, the key Fibonacci ratios are .382, .5, .886, 1.618, and 2.618. The idea is that the different lows and highs in the pattern will be these ratios of the previous number in the preceding trend.
Fibonacci series are numbers that form some harmonious relationship with the numbers preceding it. The most basic Fibonacci sequence is one in which the next number in the set is the sum of the two preceding numbers: 0,1,1,2,3,5,8, etc. They are named after a 13th-century mathematician, Leonardo Fibonacci, and are numbers that often occur throughout nature as well as in security markets.
How Do You Identify a Bat Pattern?
In harmonic trading, the theory is that a bat pattern can be identified by using specific ratios of security prices. In a bat pattern, we can refer back to the figure above. Points X and A are defined as the swing high and swing low points. For this to be a bat pattern, each number needs to be the specific ratio of the other two numbers to which it’s compared; if it is outside of these ratios, it isn’t a bat pattern.
What Types of Bat Patterns are There?
There are two types of bat patterns: bullish bats and bearish bats. They both utilize the same Fibonacci ratios in their calculations. A bullish market is one where security prices are tending to rise, while a bearish market is one where they tend to fall. The differences are described below:
Bullish Bat
A bullish bat is one in which the price will end up trending upward. The picture above is an example of a bullish bat. In this instance, X is the lowest price, with A, B, and C being the various market corrections in the price. As these corrections occur, the price of the security will eventually trend downward toward D, at which point they will start to retrace the entire pattern again.
Bearish Bat
A bearish bat, on the other hand, is a pattern in which the price will end up trending downward. It is essentially the reverse of the bullish bat, where you are looking for the high point at which to sell your security. You are essentially betting the security price will fall from that point. It utilizes the same ratios as the bullish bat, just in reverse order. Here is an example of a bearish bat pattern:
How Do You Trade Using the Bat Pattern?
Trading using the bat pattern is typically used when trading options on securities. The bat pattern intends to be universally applicable across any security class, whether those securities are stocks, bonds, commodities, forex, or cryptocurrency. The bat pattern, as well as the other various patterns included in harmonic pattern trading, is utilized by technical traders. They attempt to predict future prices by previous trends in the security price.
Typically, technical traders will employ the use of sophisticated automated software programs designed to identify a potential reversal zone in the price. It also requires the use of computer trading programs that will make a trade at a specific price.
The bat pattern is one of several trends experienced technical traders look for when looking for a place to enter the market. However, it is critical to the practice that a trader strictly adhere to the ratios presented. If these ratios are not present, it is not a true bat pattern, and it loses its predictive power.
Support Levels
Key to the concept of trading using a bat pattern is the concept of support levels and resistance levels. Technical trading attempts to predict future price moves by analyzing historical price moves. A support level is a level that a price has typically not fallen below in the past because a significant number of buyers will buy at that price, thus driving the price back up.
Resistance Levels
Resistance levels, on the other hand, are the opposite of a support level. It is a price that a security has had trouble going higher than because of a sudden uptick in the number of sellers who want to sell at that price. Once that reaction is triggered, and a certain number of shares are sold, the price will begin to fall again.
Author’s Recommendations: Top Trading and Investment Resources To Consider
Before concluding this article, I wanted to share few trading and investment resources that I have vetted, with the help of 50+ consistently profitable traders, for you. I am confident that you will greatly benefit in your trading journey by considering one or more of these resources.
- Roadmap to Becoming a Consistently Profitable Trader: I surveyed 5000+ traders (and interviewed 50+ profitable traders) to create the best possible step by step trading guide for you. Read my article: ‘7 Proven Steps To Profitable Trading’ to learn about my findings from surveying 5000+ traders, and to learn how these learnings can be leveraged to your advantage.
- Best Broker For Trading Success: I reviewed 15+ brokers and discussed my findings with 50+ consistently profitable traders. Post all that assessment, the best all round broker that our collective minds picked was M1 Finance. If you are looking to open a brokerage account, choose M1 Finance. You just cannot go wrong with it! Click Here To Sign Up for M1 Finance Today!
- Best Trading Courses You Can Take For Free (or at extremely low cost): I reviewed 30+ trading courses to recommend you the best resource, and found Trading Strategies in Emerging Markets Specialization on Coursera to beat every other course on the market. Plus, if you complete this course within 7 days, it will cost you nothing and will be absolutely free! Click Here To Sign Up Today! (If you don’t find this course valuable, you can cancel anytime within the 7 days trial period and pay nothing.)
- Best Passive Investment Platform For Exponential (Potentially) Returns: By enabling passive investments into a Bitcoin ETF, Acorns gives you the best opportunity to make exponential returns on your passive investments. Plus, Acorns is currently offering a $15 bonus for simply singing up to their platform – so that is one opportunity you don’t want to miss! (assuming you are interested in this platform). Click Here To Get $15 Bonus By Signing Up For Acorns Today! (It will take you less than 5 mins to sign up, and it is totally worth it.)
Conclusion
The bat pattern is just one of several harmonic patterns that technical traders can use to predict where security prices will go in the near future. It is a highly technical pattern that requires several precise number ratios to be present to be accurate. Still, it is one of the most reliable models identified.
BEFORE YOU GO: Don’t forget to check out my latest article – ‘Exploring Social Trading: Community, Profit, and Collaboration’. I surveyed 1500+ traders to identify the impact social trading can have on your trading performance, and shared all my findings in this article. No matter where you are in your trading journey today, I am confident that you will find this article helpful!
Affiliate Disclosure: We participate in several affiliate programs and may be compensated if you make a purchase using our referral link, at no additional cost to you. You can, however, trust the integrity of our recommendation. Affiliate programs exist even for products that we are not recommending. We only choose to recommend you the products that we actually believe in.
Recent Posts
Exploring Social Trading: Community, Profit, and Collaboration
Have you ever wondered about the potential of social trading? Well, that curiosity led me on a fascinating journey of surveying over 1500 traders. The aim? To understand if being part of a trading...
Ah, wine investment! A tantalizing topic that piques the curiosity of many. A complex, yet alluring world where passions and profits intertwine. But, is it a good idea? In this article, we'll uncork...