One of the oldest adages in the stock market is “the trend is your friend,” and technical traders use trendlines daily to assist them in making decisions about when to buy, sell, or hold stock. Those who are new to trading may rely on gut instinct as they make their decisions, but professional traders use all tools in their arsenal. Does it also include trendlines?
Professional traders use trendlines to investigate the direction and speed of price change so they can determine when to trade a security. However, trendlines are lagging indicators, meaning they look at past data to get a sense of the future, so they’re limited in their prediction ability.
In this article, we will discuss trendlines, why they are helpful indicators, their disadvantages, and how to read trendline patterns.
IMPORTANT SIDENOTE: I surveyed 1500+ traders to understand how social trading impacted their trading outcomes. The results shocked my belief system! Read my latest article: ‘Exploring Social Trading: Community, Profit, and Collaboration’ for my in-depth findings through the data collected from this survey!
Table of Contents
What Are Trendlines and What Do They Do?
A trendline is a trading tool used to identify the likely direction of price by examining past price behavior, in hours, days, or weeks. Trendlines help uncover price trends by connecting a stock’s lowest or highest price points during a given period—for example, a week or a month.
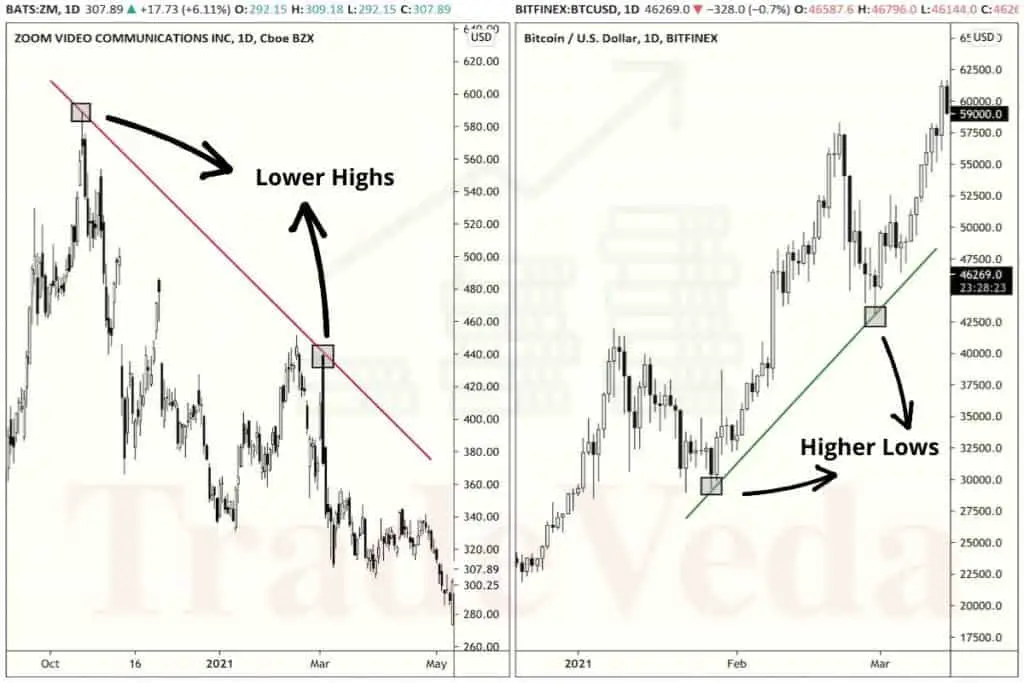
If a stock consistently hits lower lows, it is in a descending or bearish trend. In contrast, consistently higher highs are a sign of an ascending or bullish trend. However, sometimes there is no discernable trend and the price merely keeps fluctuating.
Using trendlines, you can identify potential scenarios when stock prices are likely to go low enough that investors will want to purchase or when they are likely to go high enough that investors will likely sell.
For example, professional traders know that when enough investors sell, a stock’s price goes down until it reaches a resistance point and buyers start collecting low-priced stocks, thereby reversing the trend. So, they often examine trendlines first to see how the price is likely to move. Once they decide on a stock’s potential price direction, they are better positioned to determine the optimal time for entry or exit.
Why Trendlines Are Useful Indicators?
One reason that makes trendlines a useful technical indicator is that they are simple to create and simple to read; meaning, even novice traders are likely to use them successfully with relative ease. Many professional traders say using trendlines keeps traders on the “right” side of the market, regardless of the fundamental factors that affect stock prices. Therefore, it is definitely worth learning how to use them.
Though occurrences like volume shifts and sudden news breaks can impact the reliability of trendlines, professionals consider trendlines to be pretty accurate in most trading scenarios. This accuracy has a lot to do with the psychology of human behavior, which is pretty predictable.
Therefore, although any event can impact the market, human behavior typically responds the same way in each event. By tracking the trends, traders remove emotion from the equation and instead rely on data to make decisions void of fear or greed.
For example, many times stock prices will suddenly drop; however, the overall trendline indicates that the market will remain bullish. The trendline is crucial in this scenario because it helps the professional traders to ignore their impulse to sell, and instead, wait until the market corrects itself and the rising trend resumes.
Another example is called “buying the dip,” which can be profitable during uptrends. This scenario happens when the stock declines in position during the short-term, and the buyer purchases it at the lower price, obviously hoping for the price to rebound.
How To Use Trendlines?
No tool is foolproof, and using tools incorrectly can be counterproductive, especially in the stock market where so much money is at stake. Trendlines are only beneficial if used correctly, and while most professional traders know how to use them, some traders may benefit from a brief explanation of how to read them.
The most basic way to use the tool is to connect dots linearly. For example, you might connect lows that ascend to indicate an upwards trend, while simultaneously connecting the highs that ascend, and then connect those lines. The end result forms the angle of ascent, which exposes the strength of the price move and the relative strength of the trend. Understanding this angle is crucial to making strong entry points.
Conversely, an angle of descent suggests a downward turn indicating that a breakdown is imminent. In response to this trendline, traders will typically take a short position because the angle of descent exposes that demand for the commodity is weakening and will likely continue to weaken.
Although it may sound counterintuitive, traders stand to make significant profits in bearish markets by quickly spotting the trend and taking a short position.
Another strategy is to draw multiple lines on the same chart to expose price movement over various periods, keeping you from entering before the price gets as low as trendlines predict that it will go. By drawing multiple trendlines, traders can realize overall trends, in addition, to support and resistance levels.
Disadvantages of Trendlines
Although trendlines are used to predict future performance, they are lagging in nature, meaning they look at the present and past data. So, obviously, the trendlines will always be limited in scope. However, the most significant disadvantage is that they require constant readjustment.
Another disadvantage is that traders select their own data points, so two traders may view the same trendline differently and arrive at different outcomes using the same trendline. When this difference occurs, novice traders may lose trust in using trendlines.
Finally, trendlines are not always accurate because they assume no change in external forces.
Trendline Patterns
Professional traders use trendlines because they are simple. For example, novice traders can easily see if the lines are going up or down, but other factors such as slopes and wedges are essential to understand as well.

Here are some of the most prevalent patterns that are identified using trendlines and their meaning:
- Slopes and angles measure trend strength. By drawing lines to connect the data points, traders can easily see when a stock is gaining or losing momentum.
- Wedges indicate a consolidation phase because both lines move in the same direction. When the wedge angles downward, there is a pause in the uptrend. Wedges signal an impending decrease in volume.
- Pennants indicate volume. For example, volume generally decreases at the formation of the pennant, which often means an impending high momentum move in the stock’s price.
- Flags indicate phases in the market. For instance, flags sloping upward indicate a pause when the market is trending down, but a downward flag slope is a sign of a break when in up trending markets. With both flag slopes, volume typically declines.
- Triangles are often compared to other patterns, and they are used to determine breakouts and breakdowns.
- Cup and handles indicate a bullish continuation. Specifically, that a paused upward trend is about to continue.
- Head and shoulders indicate reversals.
- Double top indicates unsuccessful attempts to break through support or resistance.
- Gaps occur when there is a space between two trading periods, and there are three main types: Breakaway, which forms at the beginning of a trend; runaway, which gaps in the middle, and exhaustion, which gaps near the end. In the stock market, gaps are more common during earnings releases and news reports.
Author’s Recommendations: Top Trading and Investment Resources To Consider
Before concluding this article, I wanted to share few trading and investment resources that I have vetted, with the help of 50+ consistently profitable traders, for you. I am confident that you will greatly benefit in your trading journey by considering one or more of these resources.
- Roadmap to Becoming a Consistently Profitable Trader: I surveyed 5000+ traders (and interviewed 50+ profitable traders) to create the best possible step by step trading guide for you. Read my article: ‘7 Proven Steps To Profitable Trading’ to learn about my findings from surveying 5000+ traders, and to learn how these learnings can be leveraged to your advantage.
- Best Broker For Trading Success: I reviewed 15+ brokers and discussed my findings with 50+ consistently profitable traders. Post all that assessment, the best all round broker that our collective minds picked was M1 Finance. If you are looking to open a brokerage account, choose M1 Finance. You just cannot go wrong with it! Click Here To Sign Up for M1 Finance Today!
- Best Trading Courses You Can Take For Free (or at extremely low cost): I reviewed 30+ trading courses to recommend you the best resource, and found Trading Strategies in Emerging Markets Specialization on Coursera to beat every other course on the market. Plus, if you complete this course within 7 days, it will cost you nothing and will be absolutely free! Click Here To Sign Up Today! (If you don’t find this course valuable, you can cancel anytime within the 7 days trial period and pay nothing.)
- Best Passive Investment Platform For Exponential (Potentially) Returns: By enabling passive investments into a Bitcoin ETF, Acorns gives you the best opportunity to make exponential returns on your passive investments. Plus, Acorns is currently offering a $15 bonus for simply singing up to their platform – so that is one opportunity you don’t want to miss! (assuming you are interested in this platform). Click Here To Get $15 Bonus By Signing Up For Acorns Today! (It will take you less than 5 mins to sign up, and it is totally worth it.)
Conclusion
Trendlines, like all tools, are great to use when employed correctly. Using trendlines keeps you alert to trade opportunities and helps you decide on entry and exit points.
Still, though professional traders use them, they are most effective in combination with other tools, like moving averages, MACD, and the Ichimoku Cloud. Only then will you have an accurate picture of what the lines are trying to reveal.
BEFORE YOU GO: Don’t forget to check out my latest article – ‘Exploring Social Trading: Community, Profit, and Collaboration’. I surveyed 1500+ traders to identify the impact social trading can have on your trading performance, and shared all my findings in this article. No matter where you are in your trading journey today, I am confident that you will find this article helpful!
Affiliate Disclosure: We participate in several affiliate programs and may be compensated if you make a purchase using our referral link, at no additional cost to you. You can, however, trust the integrity of our recommendation. Affiliate programs exist even for products that we are not recommending. We only choose to recommend you the products that we actually believe in.
Recent Posts
Exploring Social Trading: Community, Profit, and Collaboration
Have you ever wondered about the potential of social trading? Well, that curiosity led me on a fascinating journey of surveying over 1500 traders. The aim? To understand if being part of a trading...
Ah, wine investment! A tantalizing topic that piques the curiosity of many. A complex, yet alluring world where passions and profits intertwine. But, is it a good idea? In this article, we'll uncork...