The Donchian Channel was originally developed in the twentieth century by Richard Donchian, also known as “the father of trends.” It is essentially a moving average indicator—one of many different technical trading indicators that are employed by technical analysts to trade in a variety of asset markets. Donchian Channels are often used to identify trends, such as bullish and bearish behaviors in the market, and more.
What is a Donchian Channel? A Donchian Channel is a form of price-triggered, trend-following trading indicator. The terms “price-triggered” and “trend-following” here mean that the components of this indicator are calculated with the asset’s price and show how the price is changing over a determined number of periods in the given market.
The Donchian Channel features three lines: an upper, a lower, and a middle band. These bands map out the highest, lowest, and median price levels, respectively, of an asset in its given market over n periods. In the remainder of this article, we will discuss Donchian Channels in more detail, including how to read and trade using them.
IMPORTANT SIDENOTE: I surveyed 1500+ traders to understand how social trading impacted their trading outcomes. The results shocked my belief system! Read my latest article: ‘Exploring Social Trading: Community, Profit, and Collaboration’ for my in-depth findings through the data collected from this survey!
Table of Contents
How to Read Donchian Channels?
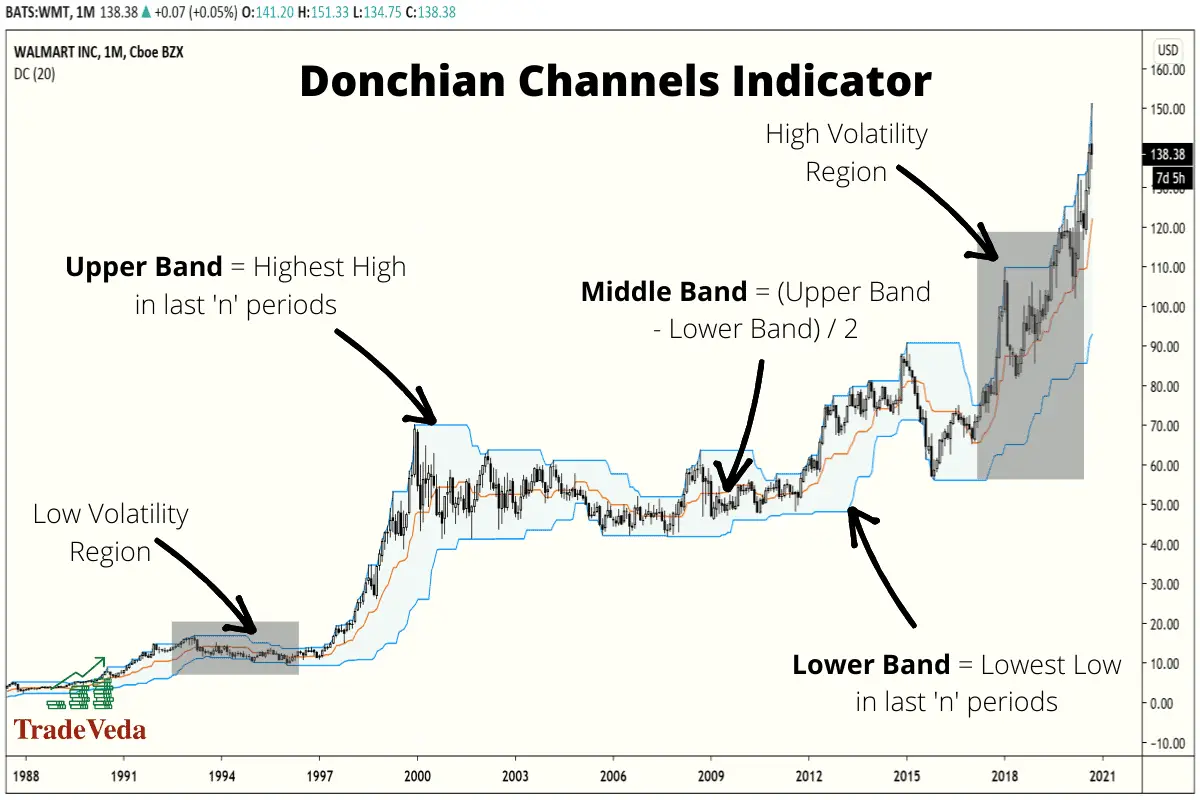
As mentioned above, a Donchian Channel is made up of three lines, also called “bands” that represent the maximum, minimum, and median of the price range of an asset over n periods.
- The Upper Band: This line shows the highest high that the price has made over n periods.
- The Lower Band: This line shows the lowest low that the price has made in n periods.
- The Middle Band: The middle line is a midpoint between the upper and lower bands.
How are Donchian Channels Calculated?
To calculate the bands of the Donchian Channel, first choose a period, n. “n” is only a variable meant to represent the time, be it in hours, days, weeks, months, or even years. Because 20 is often the default used for n with Donchian Channels, let us use 20 days as n in this explanation.
It is important to note here that the current time period is not included in the calculation of the parts of the Donchian Channel, so in this explanation, n is represented by the last 20 days before today.
Now, let us first go over how you would calculate the upper band:
- At each time point on your chart, use the previous n periods. So, in our case, we will look at the last 20 days for each position.
- Find the highest price for each of the periods you outlined above. So, for our example, find the highest price for the past 20 days relative to each point in your chart. This method, in a way, is similar to how the moving average is calculated, but in this method, instead of looking for the average, we want the maximum.
The lower band is calculated the same way the upper band is, except for one difference. Instead of finding the highest price, now we want the lowest price.
Finally, to find the points of the line the make up the middle band, we just find the middle of the corresponding positions of the upper and lower bands:
Middle Band = (Upper Band – Lower Band) / 2
Essentially, the middle band can be used to determine the “average between the highest high over N periods and lowest low over N periods”.
How to interpret Donchian Channels?
Donchian Channels are primarily used to determine the volatility of a market and to identify points where the price of the asset “breaks out” or passes the limits set by the upper and lower price bands.
Volatility is shown visually by the spread that exists between the upper and lower bands. When a market is highly volatile, the space between those two lines will be greater. High volatility means that the price security often changes, and that it changes with wide variations. When it is less volatile, the two lines will be closer to each other. Low volatility implies that the change in the asset’s prices over the given period was not as varied or unpredictable.
The “breakouts” above are significant because they indicate a substantial change from the current trend in the given market. The levels on your chart are psychological: they represent the views of everyone trading the asset at a given price level. Traders look for “breakouts” because new trends capitalized on in a timely manner provide an opportunity for them to acquire sizable profit in a relatively short time.
The position of the price with respect to the Donchian Channel can also be used to determine valuable information about market psychology. There are four locations on the chart where the current price may fall relative to the bands of the Donchian Channel, and each of these locations provides unique insights with respect to the market psychology. These four locations are as follows –
- Below the Lower Band: When the price breaks below the lower band, a downtrend (a period of low demand and lowering prices) could be developing.
- Above the Upper Band:When the price breaks above the upper band, it could mean that an uptrend is forming, and the assets price and its demand are both shifting upwards.
- Between Lower and Middle Band: When the price falls between the lower and the middle band, the price is range-bound and traders can anticipate a bounce or breakout from the lower band.
- Between Middle and Upper Band: When the price falls between the middle and the upper band, the price is range-bound and traders can anticipate a reversal or breakout from the upper band.
Trading strategies and decisions can be made based on the location and direction of the price within the chart. The upper and lower bounds can be used as dynamic support and resistance; these are price points beyond which a stock will typically not fall beneath or exceed. The support serves as a price floor, while the resistance plays the role of a price ceiling.
How Reliable are Donchian Channels in Trading?
When you use a Donchian Channel, you are essentially relying on information concerning the past pricing trends of an asset to predict how its prices will react in the future. A research study published in the Journal of Economic Surveys by Park and Irwin (2007) shows that this form of trading indicator is useful in a variety of speculative markets, including the foreign exchange, the stock and the futures market.
The downside of using Donchian Channels in isolation is that though they simplify spotting a breakout or a trend in the data, and that on their own they do not tell the whole story because they do not provide any new information. Hence, it is hard to predict how an asset’s price will act once it has broken out of the trend shown by the Donchian Channel.
Therefore, to maximize the effectiveness of implementing a Donchian Channel to your trading strategy, it needs to be combined with other tools of analysis where it can be used as a tool of confirmation to bolster your trading plan. The next section delves deeper into some of these complementary tools that can be coupled with a Donchian Channel to make up for its shortcomings.
How to Improve the Reliability of Donchian Channels for Trading?
As stated in the previous section, Donchian Channels can prove to be a great tool for identifying price trends and breakouts. However, just like with any other technical or chart indicator, you will need to combine Donchian Channels with other forms of technical analysis, to identify any high probability trading opportunities using them.
Donchian Channels can give you some really good trading signals, but you must not act on those trading signals until you get a confirmation signal on them using other forms of analysis. In fact, for a high probability of success in trading, you should never rely on the trading signals from any one technical or chart indicator. Your trading strategy must always combine signals from several complementary methods or tools.
Now, let us discuss several tools/concepts in technical analysis that you can use to improve the reliability of Donchian Channels.
Listed below are several tools in technical analysis that you can use in combination with Donchian Channels to improve their reliability –
- Japanese Candlestick Patterns
- Pivot Points
- Divergence
- Crossover Trading
Japanese Candlestick Patterns
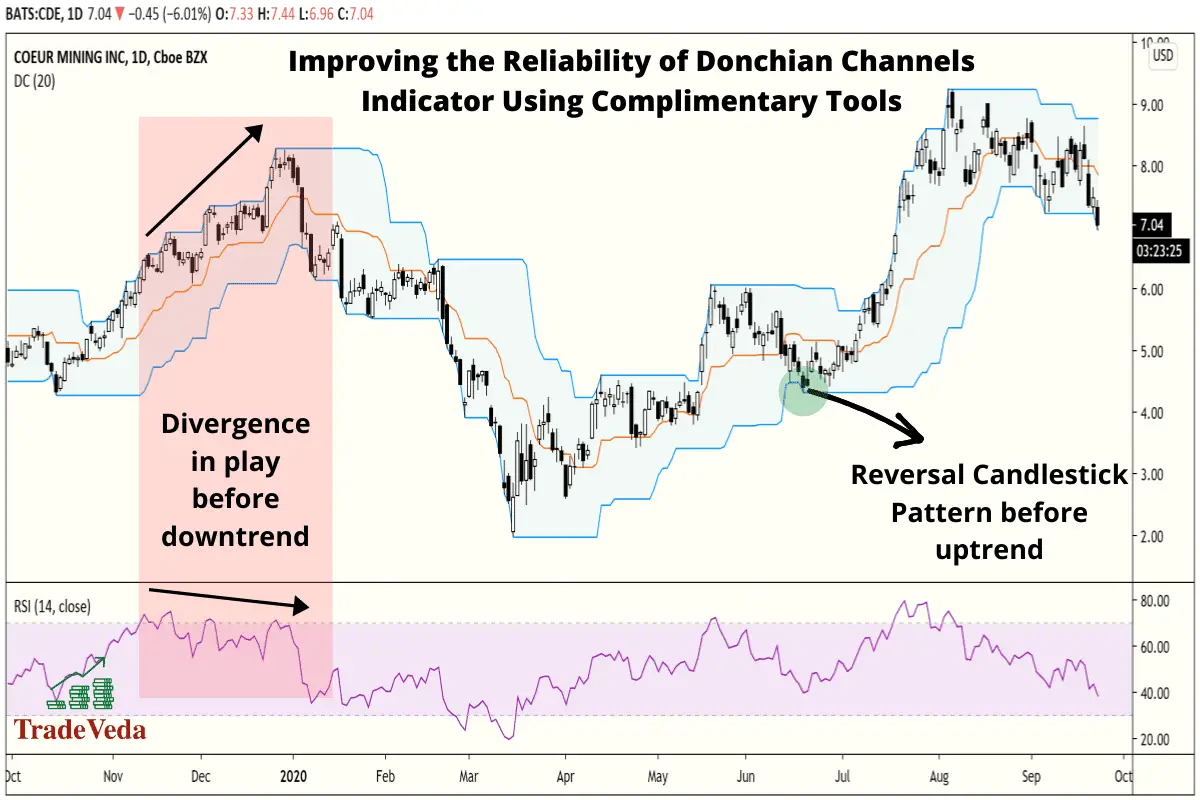
In my personal trading experience, I have found the Japanese Candlestick Patterns to work really well with the Donchian Channels.
Depending on your trading strategy and the trading signal that you seek to confirm, having a good understanding of Reversal Candlestick Patterns, Continuation Candlestick Patterns, and Indecision Candlestick Patterns can come in really handy when trading using Donchian Channels.
Pivot Points
Using Pivot Points is another great way to confirm the trading signals that you get from the Donchian Channels.
What I love most about using Pivot Points is the fact that there is little subjectivity around their exact location on the trading chart. Hence, everyone trading the security (stock, forex pair, cryptocurrency, etc.) that you are trading, will see the exact same levels on the price chart as pivot level that you are seeing.
Therefore, combining the trading signal that you get from Donchian Channels with the trading signals from Pivot Points, can help with improving the success probability of your trades.
Divergence
Divergence, in my opinion, is a very powerful tool in technical analysis and I almost never make a trade without looking into the divergence on the price chart.
The concept of divergence helps you understand the trend momentum, which can be used as a powerful confirmation signal. While there are many technical indicators that can help you check the divergence, RSI and MACD are my go-to indicators for this purpose.
Crossover Trading
Crossover points are commonly used by traders to determine the future performance of an asset. In essence, the crossover is a point at which the asset’s price and a band from some technical indicator intersects. Alternatively, the intersection of bands from two or more indicators is also considered as a crossover.
Similar to the methods described above, the crossover strategy is another way to improve the reliability of Donchian Channels. In this strategy, you confirm your trade signal from Donchian Channel using the crossover signal with one or more complementary indicators.
Complementary indicators that could be used for a crossover strategy would be momentum indicators such as the RSI, the CCI, MACD, Stochastic, etc. Additionally, you can also look for crossovers with simple moving average or exponential moving average lines to improve the reliability of trading signals from Donchian Channels.
How to Trade using Donchian Channels?
While there are many ways in which you can incorporate the signals from Donchian Channels into your trading strategy, I have personally found three trading strategies, in particular, to be very reliable.
The three reliable ways in which you can integrate Donchian Channels into your trading strategy are as follows –
- Donchian Channels Mean Aversion Trading Strategy
- Reacting to a Market Break Above or Below the Middle Channel
- Donchian Channels Breakout Trading Strategy
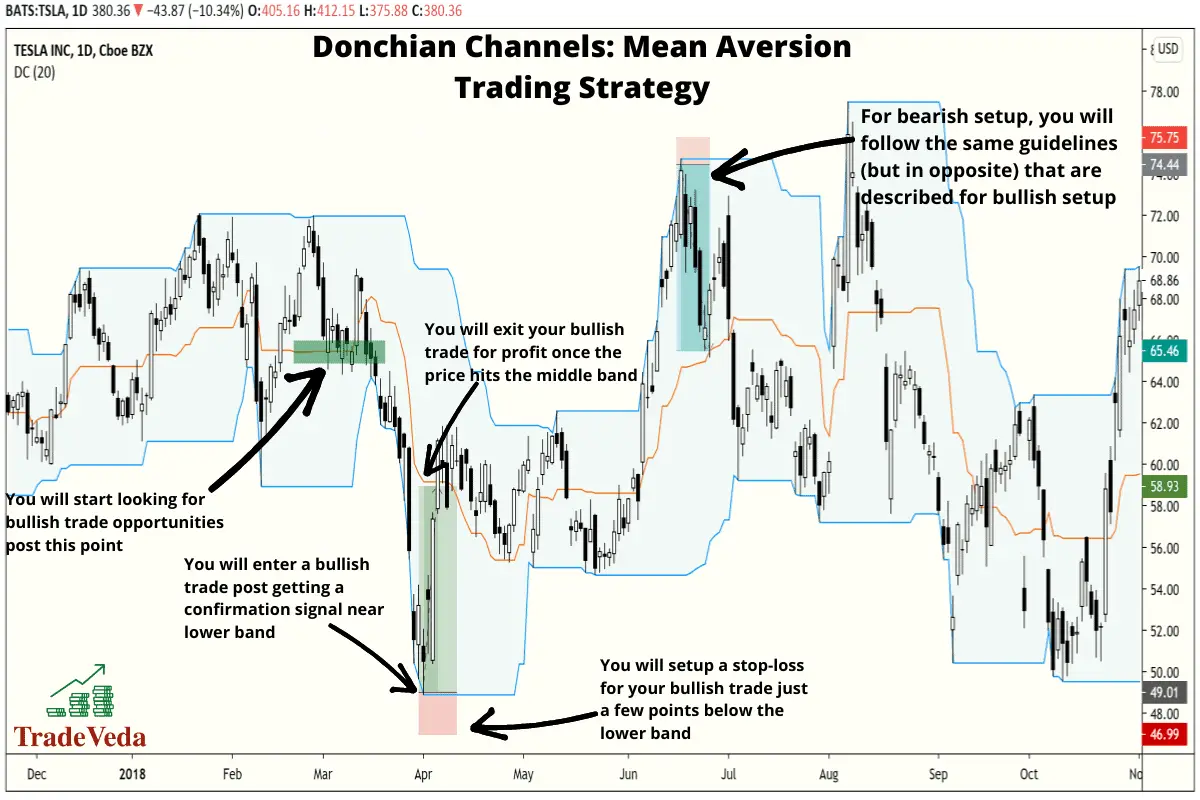
Strategy 1: Donchian Channels Mean Aversion Trading Strategy
In Mean Aversion Trading Strategy, the key hypothesis behind any trade idea is that the price will remain range-bound between the upper and the lower channel, and that it will not break past them. In essence, this strategy reacts to how price changes relative to the middle band.
To absolute beginners, this strategy might sound a bit unusual at first. This is because under this strategy when the market is doing well, instead of buying securities and owning them so that we can sell them at an even higher price (this is called “going long”), we look for “short” or “bearish” trade entries instead.
Determining Trade Entry
In this strategy, we enter the market whenever the price point crosses the middle band into a different section, and approaches the outer bands. It could either be going down towards the lower band or heading up towards the upper band.
In summary, below are the two trades entry positions under this strategy –
- Go long when the market falls beyond the middle band and approaches the lower band, and close the trade when the market rallies above the middle band.
- Go short when the market rises above the middle band and approaches the upper band, and close the trade when the market falls below the middle band.
Determining Stop Loss Target
With this strategy, the lower and upper bands can be used as your stop-loss points. This is based on our key hypothesis, that the price will not break past the Upper and the Lower bands, in this strategy.
Hence, based on the direction of your trade, below are the two stop loss targets that you would use as part of this strategy –
- If the market has fallen towards the lower band and you have taken a long position in anticipation of an upward reversal, you would put your stop loss a few points below the lower band. This is because, if the price breaks below the lower band, our key hypothesis on which this trading strategy is based gets invalidated.
- Similarly, if the market has risen towards the upper band, and you have taken a short position in anticipation of a downward reversal, you would put your stop loss a few points above the upper band.
Note: Under this strategy, depending on the trade direction, some traders like to put stop-loss exactly at the lower or the upper band. However, I would caution against this practice. Instead, I would recommend that you put your stop loss a few points above the upper band in case of a short trade, and a few points below the lower band in case of a long trade. By taking this approach you can minimize your risk of losing the trade, in case of a false breakout.
Determining Take-Profit Target
In this strategy, the middle band represents your take-profit target for this strategy.
- If the market is in the lower portion of the channel and you are anticipating an increase in price, close the trade when the price crosses the middle band.
- Conversely, if the market is in the upper portion of the channel and you are anticipating a price drop, the middle band will once again be your take-profit target.
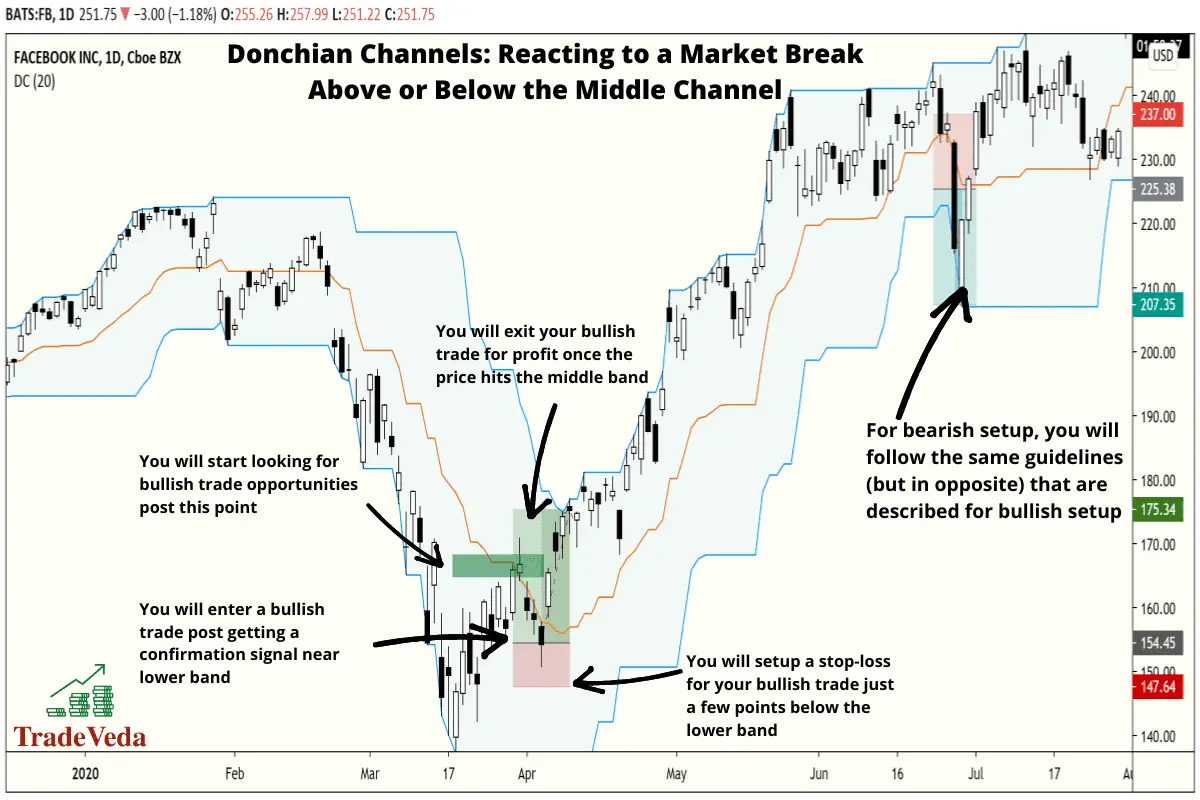
Strategy 2: Reacting to a Market Break Above or Below the Middle Channel
This strategy, as its description suggests, reacts to the changes in price pattern from being in the lower half of the channel to being in the higher half or vice versa.
In a way, Reacting to a Market Break Above or Below the Middle Channel Strategy is the opposite of the Mean Aversion Trading Strategy that we covered above.
However, the key hypothesis around which this strategy is formulated remains the same.
Similar to the Mean Aversion Trading Strategy, this strategy also assumes that the price will not break past the upper and the lower channel and that it will remain range-bound between these two levels.
Determining Trade Entry
In this strategy, anytime the price crosses the middle band, it is an indication for you to start looking for trading opportunities. This signal to look for a trade opportunities is the same as what we discussed for the Mean Aversion Trading Strategy, but your reaction in this trading strategy will be different.
In summary, below are the two trades that will seek to enter under this strategy –
- Go long when the market breaks above its middle band and close when the market reaches the upper band.
- Go short when the market breaks below its middle band and close when the market reaches the lower band.
Determining Stop Loss Target
With this strategy, you will leverage the middle band to determine your stop-loss targets.
- If the market has fallen to the lower band, you have taken a short or bearish trade under the assumption that the price will continue to fall, and you will be able to make profits from falling prices. If this does not occur and prices start to rise again, putting your stop loss a few points above the middle band will prevent you from losing all your investment.
- If the market has risen to its upper band and you have gone long, you do so with the assumption that the price will continue to grow, and you will continue to make a profit. If anything should change, however, and the price continues to fall, prevent loss by setting your stop loss just a few points under the middle band.
NOTE: If you are an aggressive trader, you can set your stop loss a few points below the lower band in case of a long trade, and a few points above the upper band in case of a short trade. However, by doing so, your risk-reward ratio will significantly change and for that reason, I would advise against it.
Determining Take-Profit Target
The upper and the lower bands will help determine your take profit targets in this strategy –
- In case of a long position, you will set your take profit target, just a few points below the upper band.
- Similarly, for short positions, your take profit target will be set just a few points above the lower band.
NOTE: If you are a more aggressive trader, you might want to keep your position open and look for a break-out trade (we will cover Breakout Trading Strategy next) once the price reaches the upper or the lower channel. However, if the price breaks out of the upper or lower bands, further assessment would be required before we can establish that a new trend has started. Therefore, unless you are an advanced and seasoned trader, I would recommend that you book your trade profit around the upper and the lower channel, and look for a breakout trade entry separately.
Strategy 3: Donchian Channels Breakout Trading Strategy
The Breakout Trading Strategy is based around the hypothesis that once the price breaks out of the upper or the lower band a new trend is established, and that the price will continue to move in the direction of this new trend.
Post breakouts, the price typically moves very fast in a relatively short time. Hence, this strategy provides traders an opportunity to generate healthy returns in a relatively short duration. Therefore, breakout trades are amongst the most sought after trades in most trading circles.
However, it must be noted that false breakouts are not uncommon in most markets, making breakout trades risky. For that reason, I would strongly recommend that you employ proper risk management and wait for a confirmation signal before taking a breakout trade.
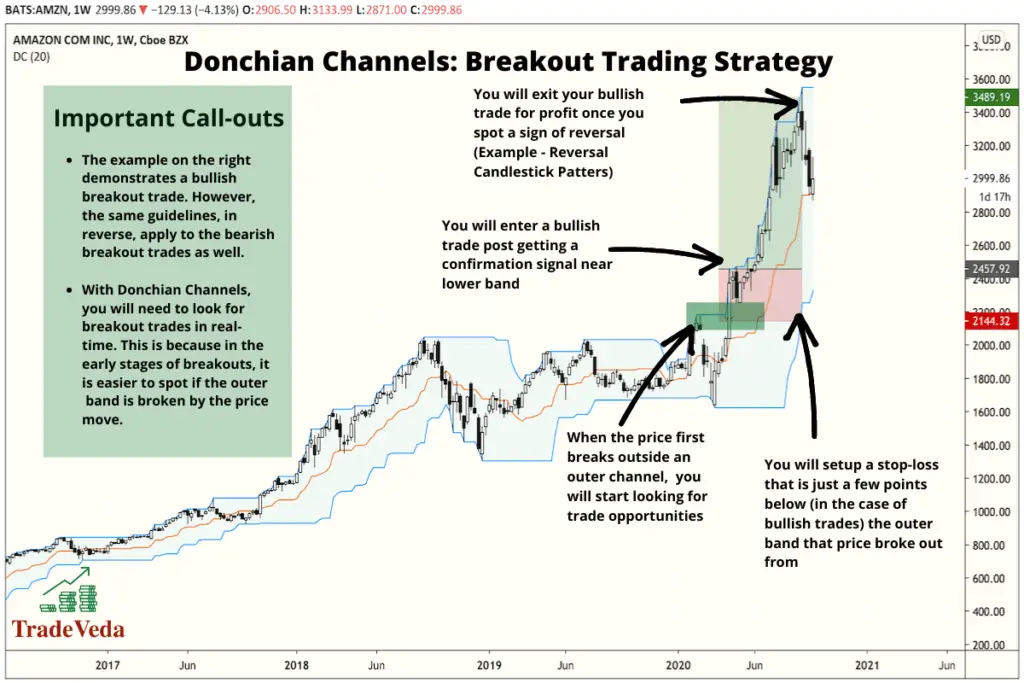
Determining Trade Entry
Price breaking above the upper band or below the lower band is our primary signal to look for trading opportunities in this strategy. Additionally, I would strongly encourage that you wait for a confirmation signal on new trend development before entering a trade. This confirmation signal can be in the form of a continuation chart pattern or a buy/sell signal from another complementary chart indicator.
High level, below are the two trade entries that you would look for when trading breakouts using Donchian Channels –
- If the price of the asset breaks above the upper band, go long after getting a confirmation signal because an uptrend could be starting.
- If the price breaks below the lower band, go short after getting a confirmation signal because a downtrend could be developing.
Determining Stop Loss Target
In this strategy, the band beyond which when the price moves we get our trade entry signal, also serves as the stop loss zone.
In summary, below is how you will put your stop loss when trading Breakouts using Donchian Channels –
- If you go long when the price breaks the upper band, you do so with the assumption that a new uptrend is in development and that the price will continue to increase. If this does not occur and the price turns around, you will minimize your losses by putting stop loss just a few points below the upper band.
- The opposite will hold true in the case where price falls below the lower band, and you are expecting a new downtrend to form. If that does not occur, you will cut your losses by putting your stop loss just a few points above the lower band.
Determining Take-Profit Target
The approach for setting take profit targets under the Breakout Trading Strategy is very different from the other two trading methods described above. This is because, under this strategy, the price moves into the uncharted territory and is not longer range-bound.
Even though the Donchian Channel and the information it provides on the historical price movements is invaluable. However, it needs to be complemented with an indicator that can make projections into the future. Hence, you will need to leverage signals from other chart indicators or patterns to determine your take profit levels.
High level, when trading with the breakout strategy, you will close your trade for profit when the momentum of the newly formed trend begins to slow, or you start getting signals for a potential reversal.
Listed below are examples of a few methods that I have personally used in determining the take profit levels for breakout trades. In your trading strategy, you should use a combination of these methods to determine the take-profit targets for your trades –
- Fibonacci Extension Levels: In my personal trading experience, I have found Fibonacci Extension Levels to be very reliable in determining the take profit levels. When combined with other indicators/tools, these levels can prove to be very powerful.
- Divergence: Divergence indicates the slowness in a trend’s momentum. Hence, when you see continuous divergence in the price trend, it is often a signal for upcoming reversal.
- Moving Average Crossovers: Crossover of two or more moving average indicators, including the Donchian Channels, is another strong signal for reversal. Hence, you can leverage crossovers to determine trend reversals and use that to determine your take profit levels.
- Candlestick Reversal Patterns: Candlestick Reversal Patterns can indicate the changes in market sentiment and provide foresight into the upcoming reversals. You can use these patterns as a confirmation signal when deciding to close your trade for profit.
- Reversal Chart Patterns: Similar to Reversal Candlestick Patterns, Reversal Chart Patterns, can provide strong signals for an upcoming trend reversal. Hence, they can also be leveraged in determining the take profit levels with the Breakout Trading Strategy.
Advantages and Limitations of Trading Donchian Channels
Just as with any other indicators and concepts in technical analysis, there are several advantages and limitations of incorporating Donchian Channels into your trading strategy.
To make informed trading decisions, it is important that you are aware of these advantages and shortcomings. Therefore, in this section, let us discuss some of the primary advantages and limitations of trading with Donchian Channels.
Advantages of Trading Donchian Channels
Several important advantages of trading Donchian Channels are as follow –
- Donchian Channels are an ideal choice for the risk-averse traders.
- They give reliable information on low volatility stocks.
- They can be used in trading a market that is choppy and difficult to attach to a trend.
Limitations of Trading Donchian Channels
Several important limitations of trading Donchian Channels are as follows –
- They do not include the current price information into their calculations.
- They are not designed to deal with highly volatile stocks.
Author’s Recommendations: Top Trading and Investment Resources To Consider
Before concluding this article, I wanted to share few trading and investment resources that I have vetted, with the help of 50+ consistently profitable traders, for you. I am confident that you will greatly benefit in your trading journey by considering one or more of these resources.
- Roadmap to Becoming a Consistently Profitable Trader: I surveyed 5000+ traders (and interviewed 50+ profitable traders) to create the best possible step by step trading guide for you. Read my article: ‘7 Proven Steps To Profitable Trading’ to learn about my findings from surveying 5000+ traders, and to learn how these learnings can be leveraged to your advantage.
- Best Broker For Trading Success: I reviewed 15+ brokers and discussed my findings with 50+ consistently profitable traders. Post all that assessment, the best all round broker that our collective minds picked was M1 Finance. If you are looking to open a brokerage account, choose M1 Finance. You just cannot go wrong with it! Click Here To Sign Up for M1 Finance Today!
- Best Trading Courses You Can Take For Free (or at extremely low cost): I reviewed 30+ trading courses to recommend you the best resource, and found Trading Strategies in Emerging Markets Specialization on Coursera to beat every other course on the market. Plus, if you complete this course within 7 days, it will cost you nothing and will be absolutely free! Click Here To Sign Up Today! (If you don’t find this course valuable, you can cancel anytime within the 7 days trial period and pay nothing.)
- Best Passive Investment Platform For Exponential (Potentially) Returns: By enabling passive investments into a Bitcoin ETF, Acorns gives you the best opportunity to make exponential returns on your passive investments. Plus, Acorns is currently offering a $15 bonus for simply singing up to their platform – so that is one opportunity you don’t want to miss! (assuming you are interested in this platform). Click Here To Get $15 Bonus By Signing Up For Acorns Today! (It will take you less than 5 mins to sign up, and it is totally worth it.)
Conclusion
To conclude, a Donchian Channel is a type of trend indicator that allows technical traders to see the trend in the price changes of an asset. It serves the main functions of identifying the volatility of the asset and showing breakout points in the price. Donchian Channels are relied on more heavily to indicate a trend than being leveraged for any other insights as a trend indicator.
The upper and the lower bands of a Donchian Channel are also an excellent support and resistance levels for traders to strategize around. But, to get optimum trading results using the Donchian Channels, one needs to combine it with other trading indicators and analysis forms.
BEFORE YOU GO: Don’t forget to check out my latest article – ‘Exploring Social Trading: Community, Profit, and Collaboration’. I surveyed 1500+ traders to identify the impact social trading can have on your trading performance, and shared all my findings in this article. No matter where you are in your trading journey today, I am confident that you will find this article helpful!
Affiliate Disclosure: We participate in several affiliate programs and may be compensated if you make a purchase using our referral link, at no additional cost to you. You can, however, trust the integrity of our recommendation. Affiliate programs exist even for products that we are not recommending. We only choose to recommend you the products that we actually believe in.
Recent Posts
Exploring Social Trading: Community, Profit, and Collaboration
Have you ever wondered about the potential of social trading? Well, that curiosity led me on a fascinating journey of surveying over 1500 traders. The aim? To understand if being part of a trading...
Ah, wine investment! A tantalizing topic that piques the curiosity of many. A complex, yet alluring world where passions and profits intertwine. But, is it a good idea? In this article, we'll uncork...
