At face value, Donchian Channels looks a lot like a Bollinger Bands and may be perceived as operating identically to it. While Bollinger Bands are useful trading indicators that are widely known and used by traders in all types of security markets (such as – stocks, Forex, and cryptocurrencies), Donchian Channels can offer comparatively more reliable trading opportunities depending on the trading scenario and your trading strategy. But is one indicator better than the other?
It depends on the nature of the market one is trading in, the asset and its volatility, the trading strategy, and the risk tolerance of the trader. In cases where the market volatility is high and/or the trader has moderate to high-risk tolerance, Bollinger Bands will prove to be a better trading indicator.
Bollinger Bands are dynamic, react faster, and are agile to use for high volatility assets.
But the opposite is also true: there are situations where you should choose Donchian Channels over Bollinger Bands. So, which situations should you be more inclined to use one as opposed to the other? In the remainder of this article, alongside discussing the key similarities and differences between the two indicators, we’ll discuss those conditions in detail.
IMPORTANT SIDENOTE: I surveyed 1500+ traders to understand how social trading impacted their trading outcomes. The results shocked my belief system! Read my latest article: ‘Exploring Social Trading: Community, Profit, and Collaboration’ for my in-depth findings through the data collected from this survey!
Table of Contents
Similarities and Differences Between Donchian Channels and Bollinger Bands
Before deciding which indicator is best suited for your market, trading asset, and trading strategy, it is vital to first understand the key similarities and the key differences between the two indicators.
Therefore, let us identify the key areas of similarities and differences between the two indicators.
Similarities Between Donchian Channels and Bollinger Bands
There are three main similarities between the Donchian Channels and the Bollinger Bands. These are:
- Indicator Appearance
- Volatility Measurement
- Indicator’s Response to Volatility Changes
Now, let us further expand on these three areas of similarities in a bit more detail.
Similarity-1: Indicator Appearance
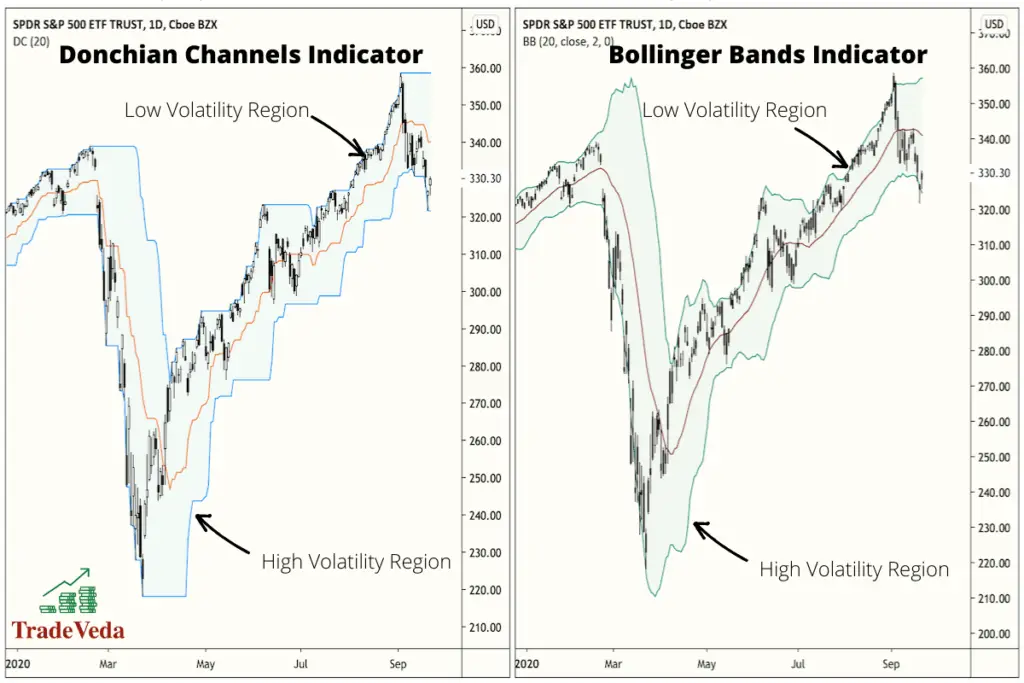
Indicator Appearance is the most noticeable commonality between the Donchian Channels and the Bollinger Bands. Both Indicators comprise of three bands – the upper, the lower and the middle band. Hence, to the eyes of a novice trader, both these indicators look exactly the same.
Similarity-2: Volatility Measurement
Both indicators, Donchian Channels and Bollinger Bands, measure the volatility of the security market that is being analyzed. A trading security is considered volatile when it records rapid fluctuations in price. Similarly, a trading security with less fluctuations in its price is considered to be less volatile.
Similarity-3: Indicator Response to Volatility Changes
With both indicators, an expansion would indicate an increase in volatility and a contraction would suggest the opposite, a decrease in volatility.
Therefore, a Donchian Channel will expand when the security market becomes more volatile and contract in the opposite case. Likewise, the upper and lower Bollinger Bands will either expand outward from the middle band or contract closer based on whether volatility is increasing or decreasing, respectively.
Differences Between Donchian Channel and Bollinger Bands
The main difference between the Donchian Channels and Bollinger Bands is that Donchian Channels represent volatility using high and low prices. In contrast, Bollinger Bands rely on the standard deviation from the mean. This means that, where Bollinger Bands will smooth out the range to account for outliers, a Donchian Channel will not and could potentially give an interpretation of the market volatility that is affected by the outliers (unusual fluctuations in price) and not be as accurate.
Additionally, Bollinger bands show the dispersion from the mean (the average of the price for a given period), whereas the Donchian Channel shows the actual market range.
That being said, there are three key differences between the Donchian Channel and the Bollinger Bands. These are –
- Indicator Calculations
- Relationship between Indicator Bands
- Breakout Interpretation
Now, let us further expand on these three areas of differences between these two indicators.
Difference-1: Indicator Calculations
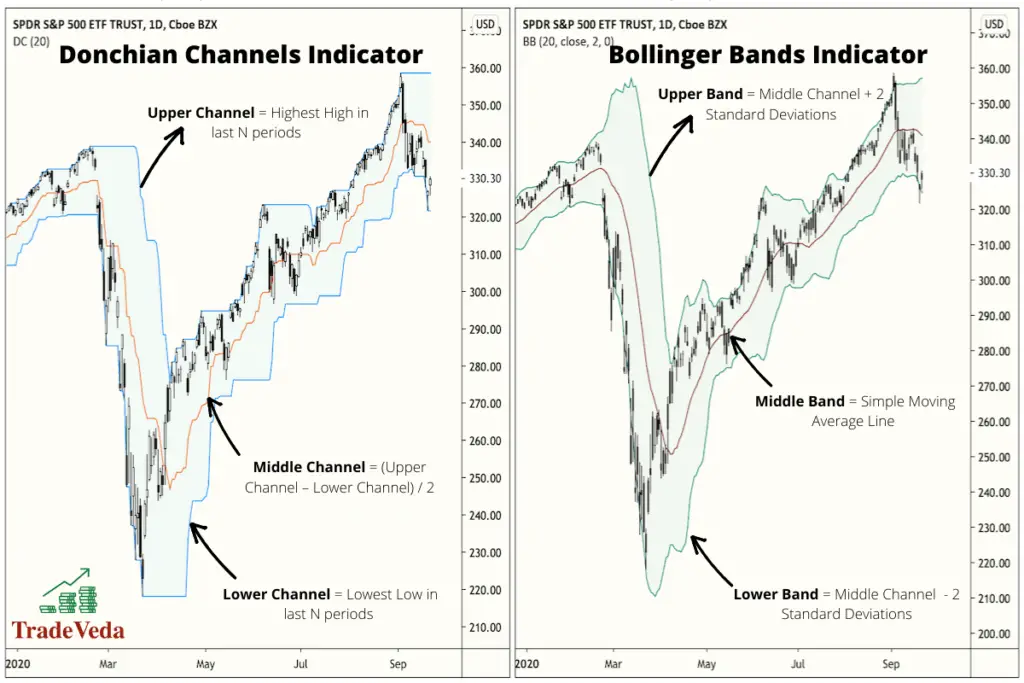
The Donchian Channels record the highest highs and the lowest lows of a price over a given period. But Bollinger bands plot the difference of two standard deviations (under default indicator setting) from the simple moving average of the price data for the period. This means Bollinger Bands make provisions to account for outliers and prevent them from skewing the data analysis.
Difference-2: Relationship between Indicator Bands
The upper and lower lines (or bands) in a Bollinger Bands indicator are calculated using the middle line of that indicator:
Upper Channel = Middle Channel + 2 Standard Deviations
Lower Channel = Middle Channel – 2 Standard Deviations
The opposite is true for the Donchian Channels indicator in which the middle line is rather calculated by taking an average of the upper and lower lines:
Middle Channel = (Upper Channel – Lower Channel) / 2
Difference-3: Breakout Interpretation
When price breaks outside of the upper or the lower channel, it has different interpretations for trading using the two indicators.
In the case of Bollinger Bands, a breakout outside the upper or the lower band indicates a potential reversal in trend. A breakout in the price above the upper band of Bollinger Bands suggests that perhaps the market has been overbought and is due to bounce back. Likewise, when the price of the asset breaks below the lower band of the Bollinger Bands, it indicates that prices have fallen too much and are due to bounce back.
But, the same is not true for the Donchian Channel. In the case of Donchian Channel, a breakout is indicative that the price has broken out of its recent trading range and a new trend may be developing. If the price of the asset breaks above the upper band of the Donchian Channel, you go long because an uptrend could be developing. Again, if the price breaks below the lower band of a Donchian Channel, a downtrend could be developing, so you go short.
When Should You Choose Bollinger Bands Over Donchian Channel?
When it comes to application in trading, both Bollinger Bands and Donchian Channels have their own strengths. There are three trading scenarios in which Bollinger Bands will give you better results than the Donchian Channel. These are:
- Early Trade Entry and Exit Signals
- Trading High Volatility Assets
- Higher Number of Trading Opportunities
Now, let us discuss each of these three scenarios in a bit more detail.
Scenario-1: Early Trade Entry and Exit Signals
Bollinger Bands will position you better than the Donchian Channels in making early trade entries. This is because this indicator reacts quicker to the changing market, thereby providing traders with an early trade signal. For this very reason, Bollinger bands are also better suited for tracking markets that have rapidly changing trends. The moving average used in Bollinger Bands provides further support in determining the trade entry and exit points.
Scenario-2: Trading High Volatility Assets
Bollinger Bands will also prove to be a better indicator of choice when trading high volatility assets. Donchian Channels do not include the current price of an asset in their calculation to produce the upper, lower, and middle bands, but instead, rely on the previous rates of the asset in the market. This can be detrimental to trading a highly volatile asset because the most recent price is an important indicator in such markets.
Besides this, Donchian Channels are not inherently designed to deal with highly volatile assets. Their creator, Richard Donchian, was a conservative trader, and he did not create this indicator with the intension of using it for analyzing highly volatile assets. Bollinger Bands, however, are well equipped to do so and are dynamic in being able to adjust to highly volatile asset markets.
Scenario-3: Higher Number of Trading Opportunities & Dynamic Trade
If you are an active trader or a scalper looking to profit from every trading opportunity that the market presents, Bollinger Bands would better suite your trading personality. Since this indicator reacts quickly to the price changes in the market, it tends to provide more trading opportunities.
When Should You Choose Donchian Channels Over Bollinger Bands?
Bollinger Bands have many advantages over Donchian Channels, but there are several situations under which the Donchian Channels can prove to be a superior indicator. The two trading scenarios under which the Donchian Channels will deliver better trading results than Bollinger Bands are –
- Risk-Averse Trading
- Trading Choppy Markets
Now, let us cover both these market conditions in a bit more detail.
Scenario-1: Risk-Averse Trading
Donchian Channels are the ideal choice for the risk-averse trader. Bollinger Bands are dynamic indicators that react quickly to the changing market conditions. Hence, Bollinger Bands inherently come with more risk. In scenarios where your risk appetite as a trader is low, Donchian Channels will be better suited for your trading psychology.
Scenario-2: Trading Choppy Markets
Even though Bollinger Bands allow for early entry, but they are also more likely to give a false trade signal in scenarios where the price fluctuations are short-lived. Therefore, if you are trading in a market that is “choppy” or a market that does not have a clear direction, the possibility of getting a false trading signal with using Bollinger Bands is very high. Hence, I would recommend against using Bollinger Bands in such trading conditions.
In such trading scenarios, Donchian Channel will give you much better insights that will help you isolate the major trends from sideways market movement. Hence, for that reason, Donchian Channel is a better indicator to use when trading choppy markets.
Author’s Recommendations: Top Trading and Investment Resources To Consider
Before concluding this article, I wanted to share few trading and investment resources that I have vetted, with the help of 50+ consistently profitable traders, for you. I am confident that you will greatly benefit in your trading journey by considering one or more of these resources.
- Roadmap to Becoming a Consistently Profitable Trader: I surveyed 5000+ traders (and interviewed 50+ profitable traders) to create the best possible step by step trading guide for you. Read my article: ‘7 Proven Steps To Profitable Trading’ to learn about my findings from surveying 5000+ traders, and to learn how these learnings can be leveraged to your advantage.
- Best Broker For Trading Success: I reviewed 15+ brokers and discussed my findings with 50+ consistently profitable traders. Post all that assessment, the best all round broker that our collective minds picked was M1 Finance. If you are looking to open a brokerage account, choose M1 Finance. You just cannot go wrong with it! Click Here To Sign Up for M1 Finance Today!
- Best Trading Courses You Can Take For Free (or at extremely low cost): I reviewed 30+ trading courses to recommend you the best resource, and found Trading Strategies in Emerging Markets Specialization on Coursera to beat every other course on the market. Plus, if you complete this course within 7 days, it will cost you nothing and will be absolutely free! Click Here To Sign Up Today! (If you don’t find this course valuable, you can cancel anytime within the 7 days trial period and pay nothing.)
- Best Passive Investment Platform For Exponential (Potentially) Returns: By enabling passive investments into a Bitcoin ETF, Acorns gives you the best opportunity to make exponential returns on your passive investments. Plus, Acorns is currently offering a $15 bonus for simply singing up to their platform – so that is one opportunity you don’t want to miss! (assuming you are interested in this platform). Click Here To Get $15 Bonus By Signing Up For Acorns Today! (It will take you less than 5 mins to sign up, and it is totally worth it.)
Conclusion
To recap, the Donchian Channel and Bollinger Bands are both chart indicators that are commonly used by technical traders to make trading decisions. These indicators exhibit several similarities but are very different from one another. Deciding which of the two indicators is better suited for your specific trading needs will depend on many different factors such as your trading strategy, the asset you wish to trade, and the nature of that asset’s market.
It is also important to note that no indicator should be used in isolation to analyze the market. Instead, any indicator should only be a cog in the overall wheel of your trading strategy.
For optimum results, it is important that you combine various chart indicators with other complementary tools/analyses, and use the collective insights from that combination in making your final trading decisions.
BEFORE YOU GO: Don’t forget to check out my latest article – ‘Exploring Social Trading: Community, Profit, and Collaboration’. I surveyed 1500+ traders to identify the impact social trading can have on your trading performance, and shared all my findings in this article. No matter where you are in your trading journey today, I am confident that you will find this article helpful!
Affiliate Disclosure: We participate in several affiliate programs and may be compensated if you make a purchase using our referral link, at no additional cost to you. You can, however, trust the integrity of our recommendation. Affiliate programs exist even for products that we are not recommending. We only choose to recommend you the products that we actually believe in.
Recent Posts
Exploring Social Trading: Community, Profit, and Collaboration
Have you ever wondered about the potential of social trading? Well, that curiosity led me on a fascinating journey of surveying over 1500 traders. The aim? To understand if being part of a trading...
Ah, wine investment! A tantalizing topic that piques the curiosity of many. A complex, yet alluring world where passions and profits intertwine. But, is it a good idea? In this article, we'll uncork...
