Harmonic pattern trading is a security analysis discipline within the technical analysis that technical traders use to predict future price movements of a security. Price of a security moves in waves that can be broken down into specific patterns to identify trends. Ultimately, identifying various harmonic patterns and being able to interpret them correctly can enable you to enter the market at the most opportune time (depending on the investment and trading strategy that you leverage to use these patterns of course). One harmonic pattern, and perhaps the most popular among all harmonic patterns, that empowers harmonic traders in making trading decisions is the Gartley Pattern.
What is the Gartley Pattern in Technical Analysis? The Gartley Pattern involves several price retracements, each one a specific ratio of the price it retraced. It consists of five price points (X-D) that include a trend in one direction, a reversal and a retracement of 61.8%, another reversal with a retracement of 38.2%, followed by a final price swing.
The Gartley Pattern has been found to be very effective in guiding the trading strategy and the timing of the price drops or increases. It can be used in options trading and is useful across all types of securities, including not only common stocks but also Forex, cryptocurrency, and commodities. If you’re curious about how using the Gartley pattern can positively impact your trading strategy, read on!
IMPORTANT SIDENOTE: I surveyed 1500+ traders to understand how social trading impacted their trading outcomes. The results shocked my belief system! Read my latest article: ‘Exploring Social Trading: Community, Profit, and Collaboration’ for my in-depth findings through the data collected from this survey!
Table of Contents
History of Gartley Pattern
First, it may be helpful to briefly discuss the history of the Gartley Pattern. It is named after Harold Gartley, an investor from the early 20th century who is considered to be one of the earliest technical traders. He determined that there was a way for traders to predict future price moves based on the analysis of historical trends. He introduced the idea of the Gartley Pattern in his 1935 book, Patterns in the Stock Market.
In the 1970s, Scott Carney took the Gartley Pattern a step further and introduced the concept of Fibonacci ratios to the equation. Fibonacci ratios, which were named after a 13th-century mathematician, Leonardo Fibonacci, are numbers that are found throughout nature and are believed to have a high mathematical significance.
Carney discovered that these ratios could be applied to technical trading and harmonic pattern analysis, and applied Fibonacci ratios to the Gartley pattern in an effort to make it more objective and to improve its reliability. Since Carney’s revolutionary application of Fibonacci ratios, harmonic patterns have become one of the foremost schools of thought within technical analysis.
Types of Gartley Pattern
Gartley Pattern, similar to most other patterns in harmonic trading, can be split into two types:
- Bullish Gartley Pattern – In this type of Gartley Pattern, once the pattern is completed, the price of the security is expected to rise.
- Bearish Gartley Pattern – In this type of Gartley Pattern, once the pattern is completed, the price of the security is expected to fall.
You can use both these types, the Bullish Gartley Pattern and the Bearish Gartley Pattern, to effectively time your trade entries in the market, thereby maximizing your profit potential.
In principle, both types of Gartley Pattern operate exactly the same way and look for the same specific Fibonacci ratios. In other words, both these types are essentially mirror images of each other.
When making trading decisions using the Gartley Pattern, it is extremely important to note that all legs of the pattern follow the Fibonacci ratios within the prescribed guidelines, or else it is not a true Gartley Pattern. The predictive power of the pattern to forecast future price movement can get considerably reduced if its legs don’t follow the prescribed Fibonacci ratios rules.
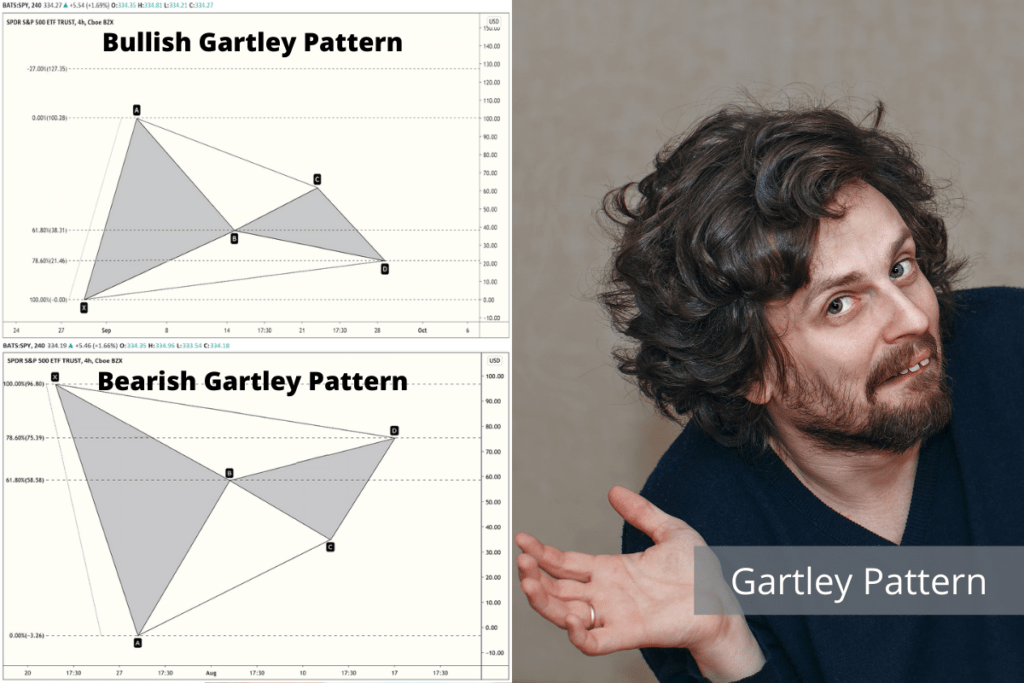
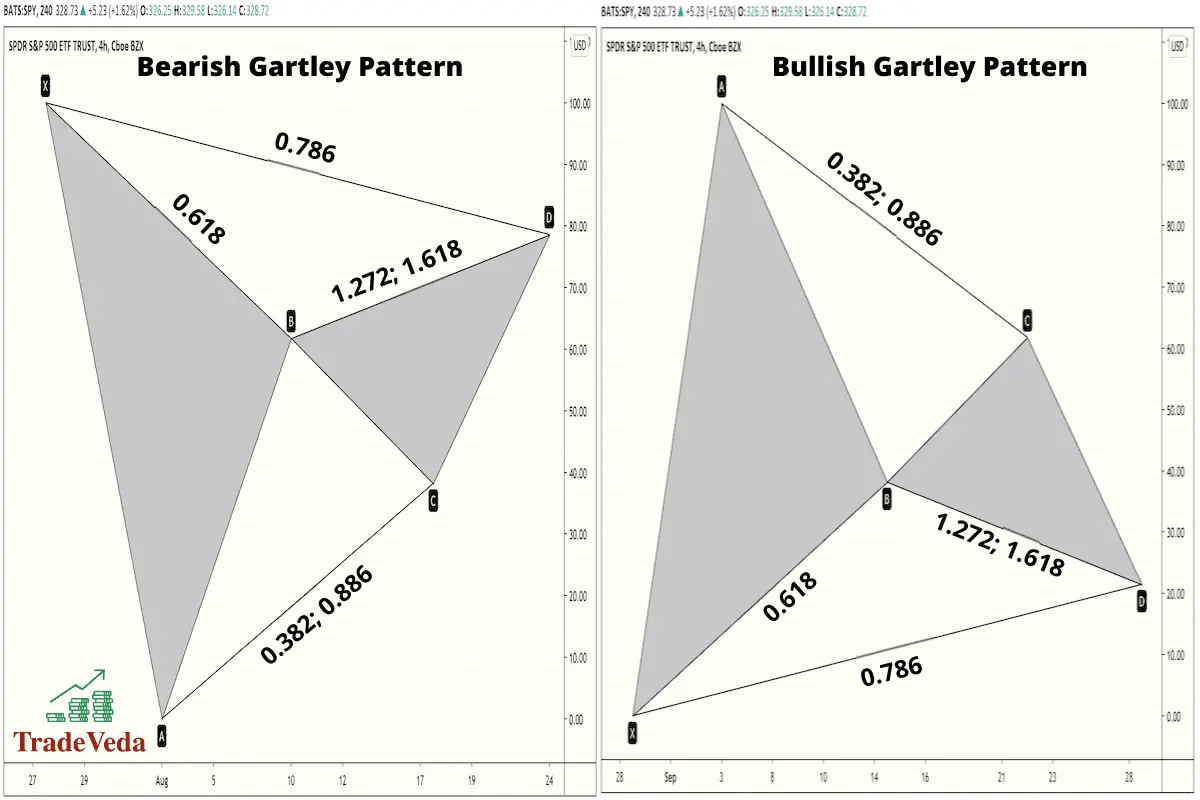
Bullish Gartley Pattern
An example of a Bullish Gartley pattern can be seen in the figure below. It consists of price point X, from which the price of the security rises sharply to point A. Then, there is a reversal and retracement to point B, with a ratio of .618. Next, the price then rises again to point C, with a ratio between .382 and .886. Finally, the price drops back to point D with a ratio of .786 when compared to point X. Additionally, the ratio between points B and D should be either 1.272 or 1.618.
Bearish Gartley Pattern
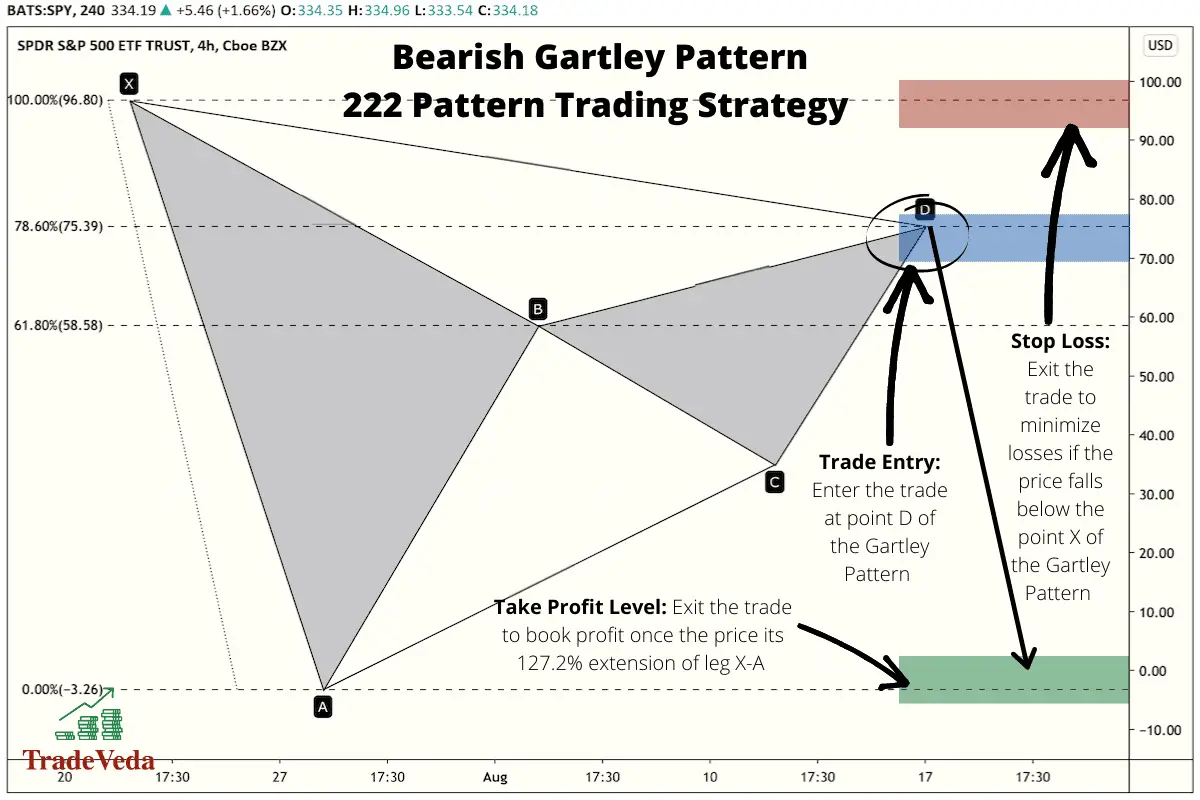
An example of a Bearish Gartley pattern can be seen in the figure below. It consists of price point X, from which point the price drops sharply to point A. Then, there is a reversal and retracement to point B, with a ratio of .618. Next, the price then drops again to point C with a ratio between .382 and .886. Finally, the price rises back to point D with a ratio of .786 when compared to point 0. Additionally, the ratio between points 2 and 4 should be either 1.272 or 1.618.
How to Identify Gartley Pattern?
As mentioned in the introduction section, the Gartley pattern has very specific ratios within which its price retracements must fall. Whether it’s a bullish or a bearish Gartley Pattern, it does not matter. This is because both types of the pattern operate in the same identical way.
There are two steps involved in accurately identifying the Gartley Pattern. These are –
- Understanding the Gartley Pattern construction rules
- Drawing the Gartley Pattern on the price chart for easy visualization
Both these steps will be covered in detail, in the following sections of this article.
Generally speaking, the ratios prescribed by the Gartley Pattern Rules must be met, and the closer they are, the more predictive power the pattern has.
That being said, you can make trading decisions based on the Gartley Pattern even if these ratios are not an exact match. However, with each standard deviation away from the prescribed Fibonacci levels, the Gartley model loses some of its predictive power. Therefore, the results that you get when trading a Gartley Pattern, constructed with minor deviations from the prescribed Fibonacci ratios, might not be as impressive.
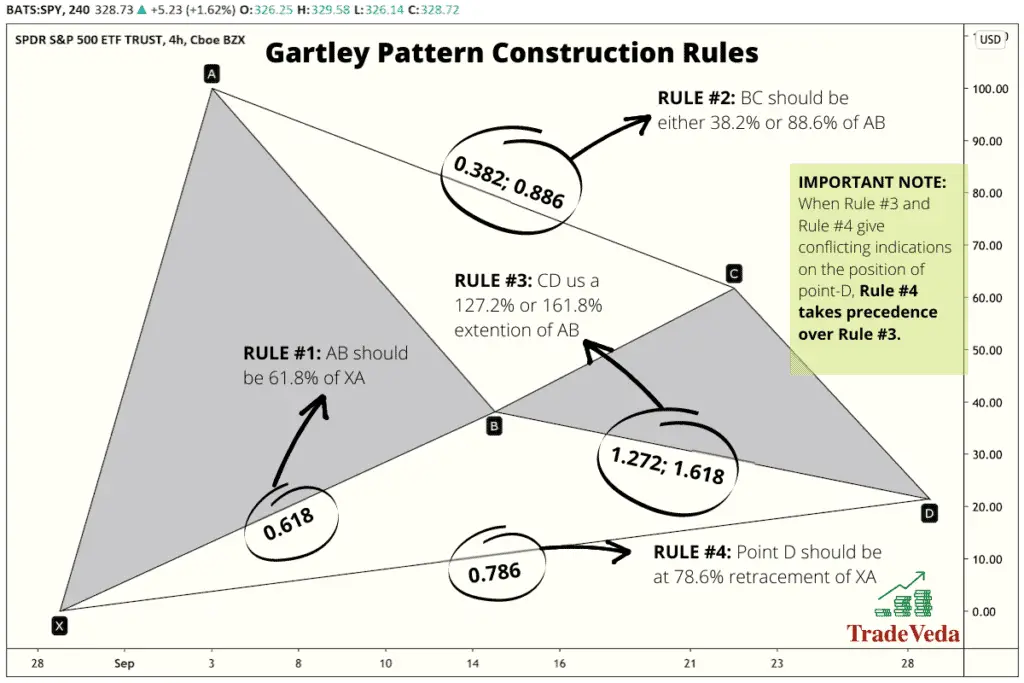
Gartley Pattern Construction Rules
In order to understand the construction of the Gartley Pattern, it’s helpful to break the model down into five distinct legs. These legs can be described as follows, and are illustrated in the diagram below:
- X-A – This leg is just an identified price movement, and there aren’t any specific ratios for it. A sharp price drop or rise clues a technical trader into the fact that there’s some movement occurring, and that it may be a harmonic pattern.
- A-B – The A-B leg should be 61.8% of the X-A leg. For instance, if the X-A leg was a price rise from 0 to $100, then A-B should be a retracement in the opposite direction of $61.8. The amount here doesn’t matter but is rather used for illustrative purposes. Hence, in this example, point B of the Gartley Pattern will fall at $38.2.
- B-C – In order for the pattern to be identified as a Gartley, this leg should be a reversal of A-B and be either the Fibonacci ratios of 38.2% or 88.6%. If we follow with our previous example, this would mean a price change of either $23.6 or $54.8. Therefore, point C of the pattern will be at $61.8 or at $93.
- C-D – This is the final leg of the pattern, and in order for the pattern to be a true Gartley, it should be either 127.2% or 161.8% of the A-B leg. It’s important to note that if B-C was 38.2%, C-D should be a 127.2% extension of A-B. Similarly, if B-C was 88.6%, then C-D will be a 161.8% extension of AB. This means the price change should be either $78.48 or $99.9, and the point D will fall at $21.4 or at $0.1.
- X-D – This calculation supersedes the CD calculation described above, in case there is a misalignment between the two. This rule states that point D of the Gartley Pattern should fall at the 78.6% retracement of X-A leg. Hence, continuing the illustration described above, the point D will fall at $21.4.
If these ratios are off, the trader might be looking at another harmonic pattern and should adjust the trading strategy accordingly.
Drawing Gartley Pattern
To draw the Gartley Pattern on a price chart, you will need two things. These are –
- Historical price data for the security that you are trading.
- Fibonacci Extension and Retracement drawing tool.
With respect to these requirements, there are a few points worth noting.
First, the granularity and the time period of the historical data that is needed for drawing the Gartley Pattern will depend on the timeframe in which you are trading.
Second, the second requirement of the Fibonacci Extension and Retracement drawing tool is more for your convenience and time-saving. Technically, you can calculate various Fibonacci ratios to draw this pattern manually. But having access to a charting platform that gives you access to a Fibonacci Retracement and Extension tool will save you a lot of time in identifying this pattern. In case your broker does not provide such charting capabilities, there are many free charting platforms that you can sign up for to get this capability.
Now, let us expand a bit more on the usage of Fibonacci Extension and Retracement tools in drawing the Gartley Pattern.
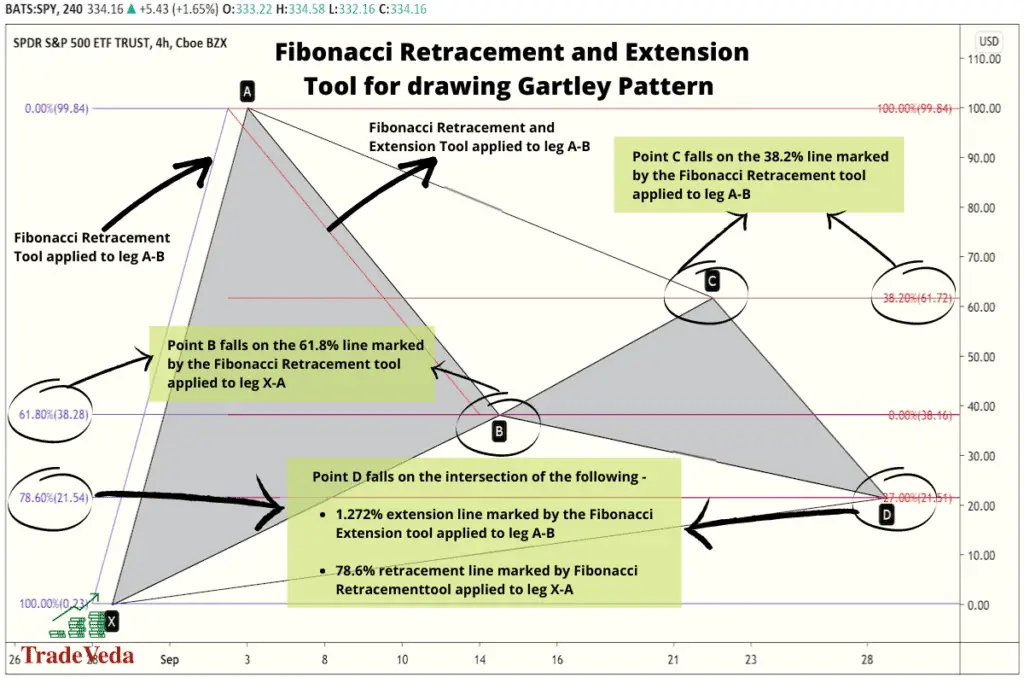
Fibonacci Retracements
Fibonacci Retracements come into play when you are mapping out the subsequent legs of the Gartley Pattern. In essence, this tool helps in determining the target price points at which two of the five legs of the Gartley Pattern should end. The Fibonacci Retracement drawing tools do this by automating and simplifying the calculations for these price points.
Particularly, in the case of the Gartley Pattern, Fibonacci Retracements can be used in determining the ending price points for the following legs:
- A-B – With this pattern, the A-B leg ends at the 61.8% retracement of the X-A leg. The price point at the 61.8% retracement of this preceding leg can be easily calculated by using the Fibonacci Retracement tool.
- B-C – For a true Gartley Pattern to form, the B-C leg of the pattern needs to end at the 38.2% or the 88.6% retracement of the A-B leg. You can use the Fibonacci Retracement tool to easily calculate these levels in a matter of seconds.
- X-D – One important rule in the construction of the Gartley Pattern is the relationship between point X and point D. As per this rule, point D should fall at the 78.6% retracement of the X-A leg. Hence, point D can be easily identified using the Fibonacci Retracement tool.
In addition to identifying the pattern legs, you can also use Fibonacci Retracements for identifying the support and resistance levels when trading Harmonic Patterns. These levels can be further used in determining the stop-loss and the take-profit targets. Some of these applications will be discussed further in the article.
Fibonacci Extensions
Fibonacci Extensions, on the other hand, come into play when you are mapping out the final leg of the Gartley Pattern. This tool can help you predict the price point at which the final wave in the construction of the pattern would end, marking the completion of the pattern. The Fibonacci Extensions tool supports this by automating and simplifying the calculation of the Fibonacci ratios used in the construction of the pattern’s final leg.
Particularly, in the case of the Gartley Pattern, you can use a Fibonacci Extension tool to forecast the following leg:
- C-D: This final leg of the Gartley Pattern should be at the 127.2% or 161.8% extension of leg A-B. You can calculate the price points at these target completion levels in a matter of seconds by deploying the Fibonacci Extensions tool.
In addition to the above-stated application, you can also use the Fibonacci Extension tool for determining you take profit targets. Personally, I heavily rely on the signals from this tool in setting the take-profit targets for my trades.
How to Improve the Reliability of Gartley Pattern in Trading?
The Gartley Pattern is counted amongst the most reliable harmonic patterns in trading. Many traders have based their trading strategy around this pattern and amassed large profits by trading it.
That being said, there are two things that you can do to improve the reliability of the Gartley Pattern in guiding accurate trading decisions. These are:
- Use accurate Fibonacci ratios in identifying the pattern
- Reduce market noise by NOT trading on a very small time frame
Now, let us expand a bit more on both these steps.
Fibonacci Ratios and Gartley Pattern’s Reliability
The Gartley Pattern is most reliable, and its predictive power is maximized when the retracement ratios exactly match the ideal Fibonacci ratios prescribed for this pattern’s construction.
For beginners just getting started with trading harmonic patterns, it is easy to get tempted into seeing a potential Gartley Pattern on the price chart that they are analyzing, even when it does not exist. Hence, it is important to be careful and not deviate too much from the ideal Fibonacci ratios when identifying these patterns.
An excellent harmonic trader sees the pattern and uses sophisticated tools to calculate Fibonacci ratios accurately. It’s only when the trader has looked at the proportions and correctly identified the potential pattern that it’s at its most reliable.
Trading Time Frame and Gartley Pattern’s Reliability
Generally speaking, the lower is the time frame on which you are trading, the higher will be the noise in the market data.
Trading on a very large time frame is definitely not an ideal setup for the Gartley Pattern. This is because such a setup will limit you from taking advantage of many opportune trading opportunities on lower time frames. However, that being said, trading on too short of a time frame can lead to numerous false trading signals when trading the Gartley Pattern.
Therefore, it is extremely important that you strike a balance between the two choices and select time frames that provide you with ample trading opportunities without adding too much noise in the market data.
As a general rule, I would recommend that you choose a time frame between 15 minutes-per-candle and 1 day-per-candle when trading the Gartley Patterns. In suggesting this, I by no means am trying to imply that time frames outside of this range would not work for trading this pattern. You sure can make some successful trades even when trading time frames outside of this range. However, in my personal trading experience, I have attained the best trading outcomes within this time frame range.
How to Trade Gartley Pattern?
When you have determined that you are, in fact, looking at evidence of a Gartley pattern, how do you begin the process of trading? One well-known strategy that can come in handy to trade this pattern is the 222 method.
Trading Gartley Pattern with 222 Pattern Strategy
“222” is another name for the Gartley Pattern. This pattern got this pseudonym after the page number on which the Gartley Pattern was first identified in Harold Gartley’s book, Profits in the Stock Market. This strategy being among the most basic and reliable strategies to trade this pattern is accordingly named “222 Pattern Strategy”. Additionally, it is also perhaps the most popular trading strategies employed by harmonic traders to trade the Gartley Pattern.
In trading the Gartley Pattern using the 222 Pattern Strategy, there are four stages involved. These are:
- Identifying Tradable Wave
- Determining Trade Entry
- Determining Stop-Loss Target
- Determining Take-Profit Target
Now, without further ado, let us dive deep into each of these four stages for trading this harmonic pattern using the 222 pattern strategy.
Identifying Tradable Legs
When trading the Gartley Pattern using the 222 Pattern Strategy, you will wait for the pattern construction to complete before taking any trades.
Hence, the price wave that you target to trade under this strategy is the wave that is forecasted to emerge once the overall construction of the Gartley Pattern is completed.
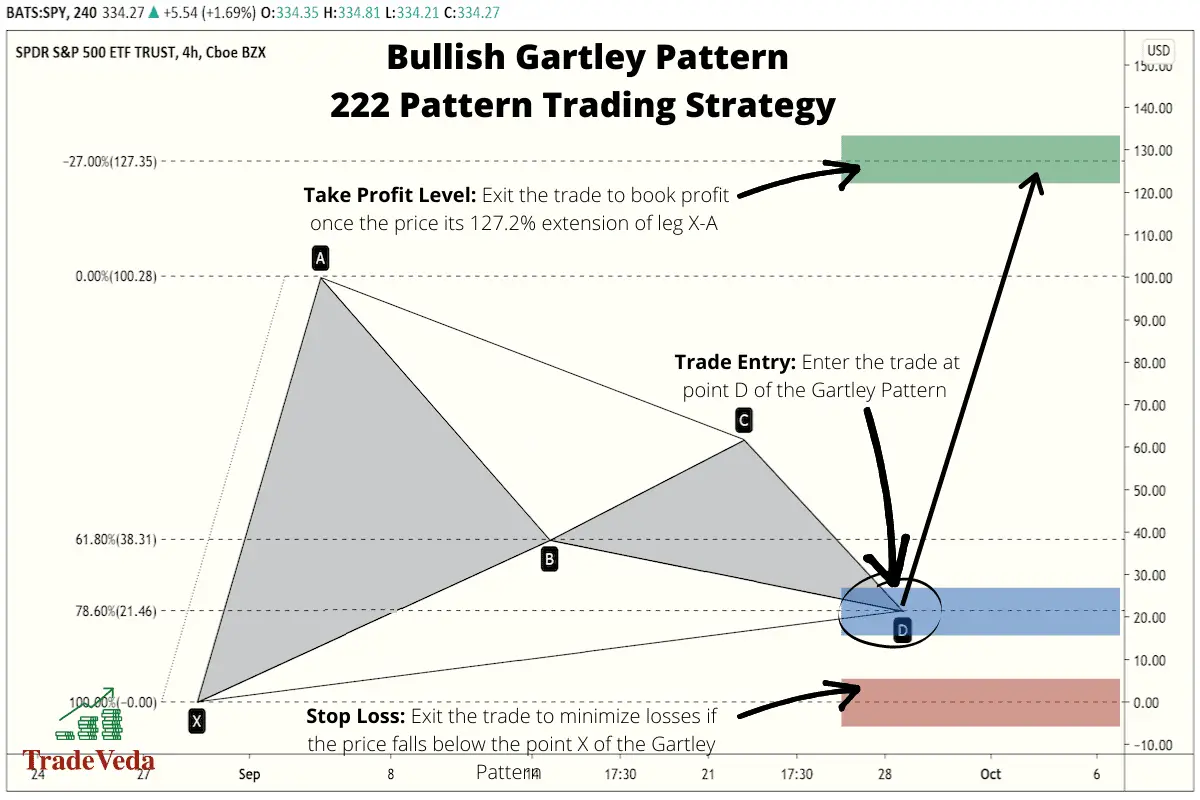
Determining Trade Entry
In this strategy, you will enter the trade when the price hits point D, at the completion of the leg C-D of the Gartley Pattern.
In the case of a Bullish Gartley Pattern, you would look for a buying opportunity at point D of the pattern. You look for this buying opportunity in anticipation that the price will bounce back and a bullish price wave will be triggered after the price hits the point D.
Similarly, with a Bearish Gartley Pattern, you would look for a selling or short-selling opportunity at point D when trading this pattern. In the case of a bearish pattern, you enter this short trade with the hypothesis that the price will stop its ascend and will fall back after hitting the point D, completing the construction of the pattern.
When entering a trade using these patterns, technical traders will often take advantage of automated trading to avoid human error, at least as much as is possible. The price points for these trades, which can simply be boiled down to a limit buy or a stop-loss sell, can be determined through the use of Fibonacci Extensions. Hence, leveraging a combination of the Gartley pattern and Fibonacci ratios, you as a technical trader can evaluate the expected ceiling or floor for Security X, and plan accordingly.
NOTE: Even though the reliability of a true Gartley Pattern is quite high, I would still recommend that you wait for a confirmation signal using other complementary techniques in technical analysis before entering a trade using this pattern.
Determining Stop-Loss Target
Setting stop-loss targets is relatively simple with the Gartley pattern. Even though harmonic patterns provide you with an objective method to trade the markets, there is no guarantee that these patterns will pan out exactly as planned. Hence, there is still a possibility of you making an incorrect trade prediction, and therefore you should always have a stop loss to minimize losses.
When trading a Bullish Gartley Pattern, you enter into a long trade when the C-D leg of the pattern is completed and the price reaches point D, in anticipation that the price will bounce back from this point. Hence, when trading a Bullish Gartley Pattern aggressively, you can put your stop loss just a few price points below the point D. This is because your assumption that we have a true Bullish Gartley Pattern gets invalidated when the price continues to fall beyond point D. That being said, putting stop loss below the price level of point X serves as a better stop loss target in trading the Gartley Patten. By setting the stop loss for your trade at this level, you minimize the risk of being taken out of the trade prematurely.
Similarly, when trading a Bearish Gartley Pattern, you enter into a short trade when the C-D leg of the pattern gets completed and the price reaches point D. You take this trade with the assumption that the ascending price will hit a ceiling at point D and then start to fall post hitting that price point. However, if that does not happen and the price continues to rise post point D, it is a signal that your trade hypothesis was wrong and that it is not a true Bearish Gartley Pattern in development. Therefore, you need to exit the trade with minimum possible losses, and you can do that by putting your stop loss just a few points above the point D when trading aggressively. However, for the reasons mentioned above, putting your stop loss above the price region of point X will serve as a better stop loss target in trading the Bearish Gartley Pattern.
Determining Take-Profit Target
Of course, the point of investing in securities is to make money, so a competent technical trader will set a take-profit target for themselves to help mitigate the detrimental effect that emotions can have on a trader.
Consider, for example, you’ve identified what you believe to be a Bullish Gartley pattern, and you’ve purchased the security at point D. You see the expected retracement begin, and according to your analysis, you’re expecting a substantial increase in price. In this case, you’re expecting a point E. When using the “222” Gartley trading strategy, you’d set a take-profit target of 127.2% of the movement from point X to point A.
To further expand on it, below is how you will decide on your take profit levels when trading a Gartley Pattern –
- You will measure the distance between point X and point A for the pattern.
- Once you have the distance between these two points, you will multiple this distance by 1.272.
- This calculated distance from step-2 is the distance you can expect the price to move in the direction of the trade from point D.
- Hence, you will put your take profit target at this distance from point D of the pattern.
All the above being said, you can always use a Fibonacci Extension tool to save considerable time and effort in identifying the take profit targets for your traded when trading the Gartley Pattern.
To recap, point A, if you’ll recall, was the first resistance point you identified, and a swing upwards (in case of a Bullish Gartley Pattern), whereas point X was the starting point in the construction of the overall pattern. Point D, on the other hand, was a support level, and the security price didn’t drop below it. You want to take the price movement between point X and point A, and multiply it by the Fibonacci ratio of 1.272 to set your take-profit target.
Setting this target for yourself takes your flawed human emotion out of the equation and renders the potential decision you’d make out of greed irrelevant. You place a limit sell on the security and boom! You sell once you hit that take-profit target. It’s that simple.
Advantages and Limitations of Trading Gartley Pattern
Just as with most other methodologies used in trading, there are several advantages and limitations of trading the Gartley Pattern.
Listed in the following sections are some of the key advantages and the key limitations of trading this pattern.
Advantages of Trading Gartley Pattern
- On relative terms, the Gartley Pattern is easy to identify and spot on a price chart.
- The Gartley Pattern works great for forecasting the short-term fluctuations in the price chart.
- By following the trading rules of the Gartley Pattern, trader emotions can be removed from trading.
- The construction of the Gartley Pattern is based on simple Fibonacci ratios that are easy to remember and draw.
- When trading this pattern, the subjectivity around setting the stop-loss and the take-profit targets get greatly reduced.
Limitations of Trading Gartley Pattern
- The reliability of the Gartley Pattern gets considerably reduced in case the Fibonacci ratios used in its construction are off.
- The Gartley Pattern is not as suitable for forecasting long-term investments as it is for forecasting short-term trades.
- In comparison to various other trading methodologies in technical analysis, incorporating this pattern into the trading strategy can be a bit complex for beginners.
- To trade using the Gartley Pattern in a scalable way, you might need an advanced charting platform.
- Trading this pattern requires a lot of patience, practice, and study.
Gartley Mutants
Since Harold Gartley first identified the Gartley Pattern in the 1930s, there have been a number of “Gartley Mutants” identified by other technical traders. Scott Carney has been at the forefront of other traders, and he both was the first to assign specific Fibonacci ratios to the Gartley and to name some of the most famous mutants.
Many of these derived patterns are named after an animal for some reason; maybe it’s because they look a little like the animal they’re named after. At any rate, some of these patterns are more well-known than others. Three of the best known and most often used, the Bat, the Butterfly, and the Crab, are shown below with their corresponding ratios in the images below. The Shark, the 0-5, the ABCD and the Three Drive are the other harmonic patterns that are considered reliable in most trading circles.
Author’s Recommendations: Top Trading and Investment Resources To Consider
Before concluding this article, I wanted to share few trading and investment resources that I have vetted, with the help of 50+ consistently profitable traders, for you. I am confident that you will greatly benefit in your trading journey by considering one or more of these resources.
- Roadmap to Becoming a Consistently Profitable Trader: I surveyed 5000+ traders (and interviewed 50+ profitable traders) to create the best possible step by step trading guide for you. Read my article: ‘7 Proven Steps To Profitable Trading’ to learn about my findings from surveying 5000+ traders, and to learn how these learnings can be leveraged to your advantage.
- Best Broker For Trading Success: I reviewed 15+ brokers and discussed my findings with 50+ consistently profitable traders. Post all that assessment, the best all round broker that our collective minds picked was M1 Finance. If you are looking to open a brokerage account, choose M1 Finance. You just cannot go wrong with it! Click Here To Sign Up for M1 Finance Today!
- Best Trading Courses You Can Take For Free (or at extremely low cost): I reviewed 30+ trading courses to recommend you the best resource, and found Trading Strategies in Emerging Markets Specialization on Coursera to beat every other course on the market. Plus, if you complete this course within 7 days, it will cost you nothing and will be absolutely free! Click Here To Sign Up Today! (If you don’t find this course valuable, you can cancel anytime within the 7 days trial period and pay nothing.)
- Best Passive Investment Platform For Exponential (Potentially) Returns: By enabling passive investments into a Bitcoin ETF, Acorns gives you the best opportunity to make exponential returns on your passive investments. Plus, Acorns is currently offering a $15 bonus for simply singing up to their platform – so that is one opportunity you don’t want to miss! (assuming you are interested in this platform). Click Here To Get $15 Bonus By Signing Up For Acorns Today! (It will take you less than 5 mins to sign up, and it is totally worth it.)
Conclusion
The original pattern in harmonic trading, the Gartley pattern, has a long and storied history in technical trading circles. It has been behind many fortunes made in technical trading and is one of the most readily identified as well as reliable patterns in harmonic trading. Indeed, it could be considered the grand-daddy of all harmonic trading patterns, as various tweaks of it have given rise to the multitude of “mutants” that we use to analyze the market today.
It is important to remember that using the Gartley Pattern requires a heroic amount of patience and objectivity, as it is too easy to get sucked into an emotional response to market moves. It is purposely designed to take emotions out of the decision-making equation, so you are much more likely to succeed in trading when making trade decisions based on the rules of this pattern.
BEFORE YOU GO: Don’t forget to check out my latest article – ‘Exploring Social Trading: Community, Profit, and Collaboration’. I surveyed 1500+ traders to identify the impact social trading can have on your trading performance, and shared all my findings in this article. No matter where you are in your trading journey today, I am confident that you will find this article helpful!
Affiliate Disclosure: We participate in several affiliate programs and may be compensated if you make a purchase using our referral link, at no additional cost to you. You can, however, trust the integrity of our recommendation. Affiliate programs exist even for products that we are not recommending. We only choose to recommend you the products that we actually believe in.
Recent Posts
Exploring Social Trading: Community, Profit, and Collaboration
Have you ever wondered about the potential of social trading? Well, that curiosity led me on a fascinating journey of surveying over 1500 traders. The aim? To understand if being part of a trading...
Ah, wine investment! A tantalizing topic that piques the curiosity of many. A complex, yet alluring world where passions and profits intertwine. But, is it a good idea? In this article, we'll uncork...