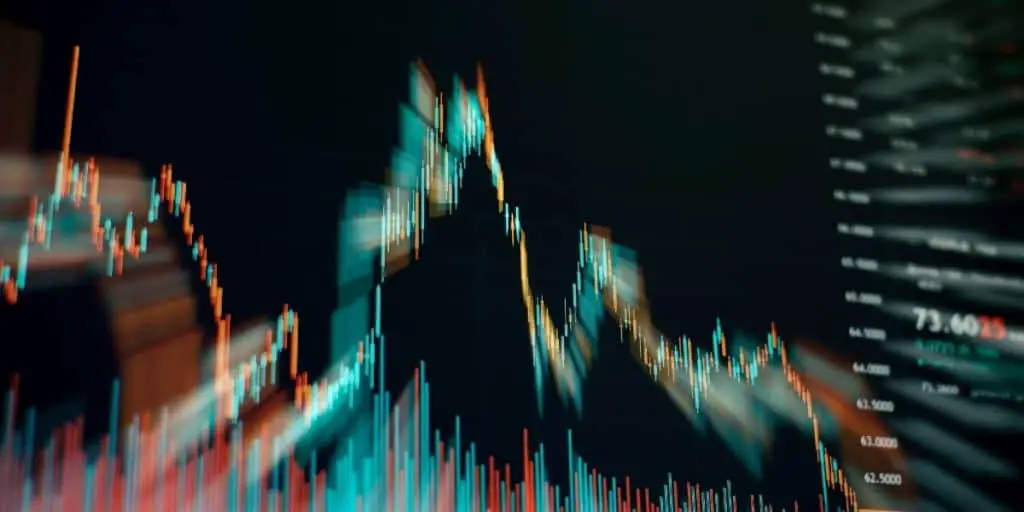
As a forex trader, you should learn a wide range of skills to help you make logical decisions based on facts. Calculating forex volume and its effects on the market is one of these skills. So, how is forex volume calculated?
Forex volume is calculated by using technical indicators such as tick volume, Volume-Weighted Average Price, On-Balance-Volume, and Money Flow Index. It’s not rocket science, but it’s difficult because it’s a decentralized market. Any volume data that traders get is from a specific broker.
Read on to see how these indexes can help traders get an idea of forex volume. We’ll also talk about the factors that affect forex volume.
IMPORTANT SIDENOTE: I surveyed 1500+ traders to understand how social trading impacted their trading outcomes. The results shocked my belief system! Read my latest article: ‘Exploring Social Trading: Community, Profit, and Collaboration’ for my in-depth findings through the data collected from this survey!
Table of Contents
The Importance of Forex Volume
Forex volume is one of the essential concepts that help traders improve their profits. It shows them the degree of risk they’re making and how much profit they should expect to make if the market goes their way.
Volume refers to the amount of an asset traded over a certain period. In forex, volume means the number of lots bought and sold in the whole market or a currency pair during a specific period. However, many traders overlook its importance and replace it with price action in their analyses.
Given the decentralized nature of forex, it isn’t easy to calculate the entire market’s volume.
That’s because there’s no data to show how many lots get traded during a specific time. The data accessible to traders is limited to brokers’ data.
Plus, brokers’ data belongs to retail traders’ executions while the prices move according to big institutional trades. So, many believe that the forex volume can’t be a good indicator of price action.
Despite these limitations, there are still some other ways to calculate forex volume.
5 Reliable Methods To Calculate Trading Volume in Forex
Tick Volume
Tick volume is an indicator offered by most brokers and platforms that shows the degree of market participation and activity. A tick corresponds to a single change, either upward or downward, in the currency’s price quote.
Although it’s impossible to know how many contracts get traded in forex, we can measure the number of ticks prices go up and down in a specific time frame.
So, instead of measuring the number of transactions that lead to a price move, we estimate the net effect, which is the price movement itself. In other words, we don’t care how many transactions move the price for one tick.
Some experts believe tick volume is a far cry from the real volume, and it can be misleading. Others believe it can be a good indicator of real volume, and after some time experimenting with tick volume obtained from your broker, you can learn how to use it in your analysis.
The VWAP Indicator
The volume-weighted average price or VWAP indicates a currency pair’s average price in one day. It’s an indicator of a pair’s value and the underlying trend. For example, some traders use it to detect a trend that looks strong but is weaker than it looks. Day traders use this indicator more than swing traders since it shows volume for one day.
The OBV Indicator
The On-balance volume indicator is a useful tool for identifying bearish and bullish trends based on the bearish or bullish nature of the day. It also indicates price movements and can be used to spot breakouts. You can calculate the overall market sentiment by adding or subtracting a day’s volume to the total running open.
A rising OBV indicates an uptrend and an upward breakout, while a falling OBV confirms a downtrend and a downward breakout.
Money Flow Index
The MFI is also a technical oscillator that shows if a currency is overbought or oversold using price and volume data. Experts consider MFI more accurate than other oscillators because it uses price and volume data, while others only use price. According to Investopedia, this index is calculated using the following formula:
MFI=100-100/(1+money flow ratio)
If the MFI index is over 80, there’s an overbought, and if it’s below 20, there’s an oversold.
Klinger Oscillator
The Klinger Oscillator calculates long-term money flow, but it remains sensitive to short-term fluctuations. It helps traders detect positive and negative trends to buy when a trend goes up and sell when it goes down. It compares the currency pairs’ volume with their price movements and changes the result to an oscillator.
It uses the volume force as its base formula calculated by multiplying volume, trend, and temp, multiplied by 100. It also uses a 13-period moving average in some cases. When the 13-period moving average crosses the oscillator in an upswing, the trend is bullish and vice versa.
What Affects Forex Volume?
Different factors affect volume. The most important one is the different market hours during which significant markets are open. For example, when the main European markets are open, the volume goes up, and then it goes down during the evening hours. Other factors include:
- Economic data. Inflation and interest rate numbers greatly affect the number of lots traded in a currency pair. Plus, international trade statistics, including trade deficits and surpluses, increase or decrease forex volume.
- Economic news. When breaking news hits the market, many traders see it as an opportunity to place trades. So, market volume spikes after a major news announcement, especially if they’re unexpected.
- Key levels. Traders always watch technical levels to trade based on them because they show buying and selling pressure changes. Investors place their orders around these key levels, so the volume can go up or down when the prices approach these levels.
Role of Volume in Trading
Expert traders recommend using volume together with price action to make trading decisions. They believe price action is the primary decision-making tool, and volume’s role is to confirm the findings. Here are the advantages of using volume:
Accumulation
When the market is under the control of buyers, accumulation happens. During a downtrend market correction, if the volume spikes, it could indicate that buyers are entering the market, potentially leading to a reversal. When volume goes higher, but the closing prices are higher than the previous day, and the price doesn’t go down despite increased volume, a reversal could occur.
Distribution
As opposed to accumulation, sellers control the market in the distribution phase. During an uptrend market correction, an increase in volume shows that the number of sellers increases, and a reversal is likely. The reversal is confirmed when the volume is more, but the closing prices are lower than the previous day, and the price doesn’t increase although the volume has moved up.
You can calculate accumulation and distribution through this formula:
AD = ((close price – open price) / (high price – low price)) * volume
A falling indicator shows the currency’s distribution, and a rising indicator signals the currency’s accumulation.
Confirm Trend Weakness and Strength
Increased and decreased volume indicate the direction of a trend. When volume increases and the price goes up, there’s an uptrend. Conversely, a downtrend occurs when the price goes down and volume decreases.
One telling sign of a weakening trend is that the price reaches extreme levels, but the volume doesn’t support them. It could also signal the end of a trend.
Confirming Breakout
In consolidation periods, volume levels remain low. When the consolidation pattern breaks and the volume increases simultaneously, it could signal a breakout.

Author’s Recommendations: Top Trading and Investment Resources To Consider
Before concluding this article, I wanted to share few trading and investment resources that I have vetted, with the help of 50+ consistently profitable traders, for you. I am confident that you will greatly benefit in your trading journey by considering one or more of these resources.
- Roadmap to Becoming a Consistently Profitable Trader: I surveyed 5000+ traders (and interviewed 50+ profitable traders) to create the best possible step by step trading guide for you. Read my article: ‘7 Proven Steps To Profitable Trading’ to learn about my findings from surveying 5000+ traders, and to learn how these learnings can be leveraged to your advantage.
- Best Broker For Trading Success: I reviewed 15+ brokers and discussed my findings with 50+ consistently profitable traders. Post all that assessment, the best all round broker that our collective minds picked was M1 Finance. If you are looking to open a brokerage account, choose M1 Finance. You just cannot go wrong with it! Click Here To Sign Up for M1 Finance Today!
- Best Trading Courses You Can Take For Free (or at extremely low cost): I reviewed 30+ trading courses to recommend you the best resource, and found Trading Strategies in Emerging Markets Specialization on Coursera to beat every other course on the market. Plus, if you complete this course within 7 days, it will cost you nothing and will be absolutely free! Click Here To Sign Up Today! (If you don’t find this course valuable, you can cancel anytime within the 7 days trial period and pay nothing.)
- Best Passive Investment Platform For Exponential (Potentially) Returns: By enabling passive investments into a Bitcoin ETF, Acorns gives you the best opportunity to make exponential returns on your passive investments. Plus, Acorns is currently offering a $15 bonus for simply singing up to their platform – so that is one opportunity you don’t want to miss! (assuming you are interested in this platform). Click Here To Get $15 Bonus By Signing Up For Acorns Today! (It will take you less than 5 mins to sign up, and it is totally worth it.)
Conclusion
Market volume is an important indicator that can help traders place logical trades on specific currencies. However, it’s impossible to calculate the whole forex market volume since it’s not a centralized market. Unlike stocks, there’s no single exchange through which all trades are executed, so there’s no unified data.
However, traders have different tools at their disposal to get a general idea of volume. Tick volume, Volume-Weighted Average price (VWA), Klinger Oscillator, On-Balance-Volume (OBV), and Money Flow Index (MFI) are some of these tools.
BEFORE YOU GO: Don’t forget to check out my latest article – ‘Exploring Social Trading: Community, Profit, and Collaboration’. I surveyed 1500+ traders to identify the impact social trading can have on your trading performance, and shared all my findings in this article. No matter where you are in your trading journey today, I am confident that you will find this article helpful!
Affiliate Disclosure: We participate in several affiliate programs and may be compensated if you make a purchase using our referral link, at no additional cost to you. You can, however, trust the integrity of our recommendation. Affiliate programs exist even for products that we are not recommending. We only choose to recommend you the products that we actually believe in.
Recent Posts
Exploring Social Trading: Community, Profit, and Collaboration
Have you ever wondered about the potential of social trading? Well, that curiosity led me on a fascinating journey of surveying over 1500 traders. The aim? To understand if being part of a trading...
Ah, wine investment! A tantalizing topic that piques the curiosity of many. A complex, yet alluring world where passions and profits intertwine. But, is it a good idea? In this article, we'll uncork...