The rising trend in candlestick trading has led to a sharp spike in the number of new technical traders signing up to use them. The reason behind the surge is that candlesticks are quite versatile, and many believe that these patterns reliably indicate future positive or negative price swings. But are these charting patterns truly reliable, accurate, and do they really work in all trading conditions?
Not all candlestick patterns are reliable, but some are, and these can form part of your trading strategy. However, the reliability of candlestick patterns can vary a lot depending on the market you trade in, the timeframe, and other related conditions relevant to your overall trading strategy.
In this article, you’ll learn all about candlestick trading, how it works, and whether it’s a reliable and accurate way to inform trading decisions.
IMPORTANT SIDENOTE: I surveyed 1500+ traders to understand how social trading impacted their trading outcomes. The results shocked my belief system! Read my latest article: ‘Exploring Social Trading: Community, Profit, and Collaboration’ for my in-depth findings through the data collected from this survey!
Table of Contents
Candlestick Trading: An Overview
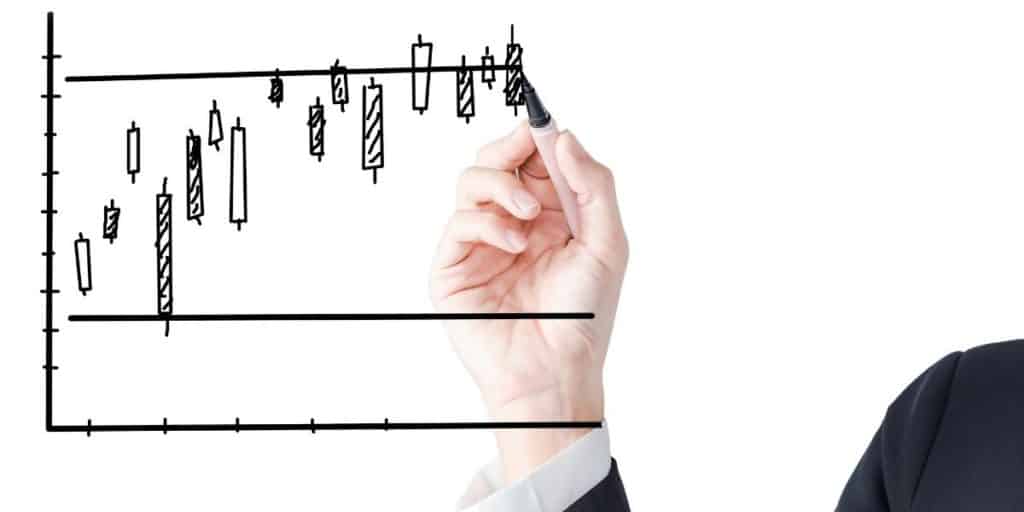
Candlestick charts rank highly among the most favored and widely used price charts in the market and provide you with valuable information on price movements within a given timeframe. But more than that, a single glance at their color codes, shapes, and patterns show you all that is currently happening in the market.
The charting techniques date back to 18th century Japan where rice merchants used them to track the pricing of rice coupons. Today, candlestick charting has almost replaced the bar, point, line, and figure charts.
How Does Candlestick Trading Work?
Candlestick charts consolidate data from a selected time frame into a single candlestick bar. They offer information about a security’s price movements, with each candlestick representing activity over a specified period such as a minute, hours, day, or month.
A candlestick will therefore indicate open, close, high, and low data points over the chosen timeframe.
It’s easy to tell whether a price has gone up or down from the color codes. Green or white colors indicate a positive (bullish) candlestick, while red or black show negative (bearish) candlesticks. A bullish candlestick usually shows a higher close price than the open price, whereas a bearish one shows a lower close price compared to the open price.
To read a candlestick, you check its color, body, and wicks. Different parts of the pattern tell a different story, and while the shape, color, or direction can appear random, sometimes several candlesticks join up to form a pattern. The candlestick patterns can reveal bullish and bearish sentiment in the market and help traders confirm their forecasts about market movements.
Does Candlestick Trading Really Work?
Traders who have experienced marginal success using candlestick trading patterns fail because they wrongly assume that every pattern follows a similar path and that the pattern forms due to a single action, such as selling for bearish pin bars. Unfortunately, this isn’t why the market pattern forms, and traders don’t proceed to conduct an analysis to help them figure out the reason behind the pattern formation.
In a nutshell, traders believe candlestick trading works because once a pattern forms, the price moves as the candlestick pattern suggests. Therefore, they assume the pattern causes the market to move as it did, and any future patterns will behave likewise.
Studies carried out on the effectiveness of candlestick patterns seem to agree that overall, the patterns are successful 50% of the time. As such, traders need to learn how to determine which patterns are likely to turn profitable and which ones will end up losing money.
Candlestick trading works when applied correctly. When this is done:
It Can Assist in Analyzing the Market
Since candlestick shapes and patterns provide valuable information regarding what transpires in the market, you can use this info to try and forecast future happenings. The patterns could signal potential market reversals, while others might indicate a continuation of current trends.
This can be of great help when analyzing the market, and it explains why some price action traders leverage the chart patterns when doing their technical analysis.
Candlesticks Make It Easier To Read Price Action
Interpreting candlesticks is simple and straightforward, even for beginner traders. You can tell the direction of price movements simply by looking at the color-coded candlesticks, which makes it much easier to analyze the market since you base your analysis on the information your chart provides.
How Accurate Is Candlestick Trading?
Most beginner traders get excited to use candlestick patterns since they provide detailed information and are pretty straightforward to use. They mostly use candlesticks to form patterns that emit clues regarding where the price will move next. Unfortunately, things don’t always work out as expected.
There are some things that the candlesticks won’t tell you. For example, you cannot tell why the open and close data points are similar or different using candlesticks and as a result, it’s not advisable to use candlestick patterns on their own.
In order to enhance your trade outcomes, you may want to use additional methods of technical analysis which include the market structure, oversold or overbought conditions, trend direction, as well as support and resistance levels.
Combining the use of candlestick patterns with today’s advanced computing and technical analysis greatly enhances their efficiency, allowing you to improve your trading strategies.
Are Candlestick Patterns Reliable?
Traders use different candlestick patterns to predict price direction. However, some of the signals from the patterns might not be that reliable as the patterns themselves might not be accurate enough.
The candlestick patterns’ massive popularity has also reduced their reliability substantially since hedge funds have analyzed them using their algorithms and use the same to lure retail traders looking to cash in on high-odds bullish or bearish outcomes.
What this means for you as a trader is that you might want to consider using candlestick patterns alongside other strategies rather than on their own. Nevertheless, learning how to use candlesticks patterns effectively is an excellent way to understand the market’s driving forces.
A number of factors highly impact the reliability of candlestick patterns, but you can trade with more confidence if you take note of them. These factors are:
- The timeframe: Short timeframes tend to be less reliable than long ones due to the higher volatility experienced, because trader sentiment is prone to more frequent changes in the short term, whereas daily or weekly timeframes promise more reliable long-term effects.
- The instrument: Trading instruments behave in different ways but what’s crucial is the traded volume (liquidity). Some candles work for forex, while others work better with stocks, but overall, the higher the volumes dealt, the more reliable the candles will be.
- The chart pattern: Consider the environment in which the candlestick happens. If there are support and resistance lines close by, the trade has the potential to work out.
- The pattern size: The larger the patterns, the more reliable they tend to get. Also, significant price movements will give out stronger signals.
- The candlestick pattern: Different candle patterns have different reliability levels. But in general, the more candles a given formation contains, the more reliable it is. The downside is that this doesn’t appear that often.

It’s important to point out that you don’t have to memorize candlestick formations to understand the price movements. This is a common mistake that new traders make. Instead, learn how the markets work, and you’ll be better placed to use trading tools like the candlestick charts.
Author’s Recommendations: Top Trading and Investment Resources To Consider
Before concluding this article, I wanted to share few trading and investment resources that I have vetted, with the help of 50+ consistently profitable traders, for you. I am confident that you will greatly benefit in your trading journey by considering one or more of these resources.
- Roadmap to Becoming a Consistently Profitable Trader: I surveyed 5000+ traders (and interviewed 50+ profitable traders) to create the best possible step by step trading guide for you. Read my article: ‘7 Proven Steps To Profitable Trading’ to learn about my findings from surveying 5000+ traders, and to learn how these learnings can be leveraged to your advantage.
- Best Broker For Trading Success: I reviewed 15+ brokers and discussed my findings with 50+ consistently profitable traders. Post all that assessment, the best all round broker that our collective minds picked was M1 Finance. If you are looking to open a brokerage account, choose M1 Finance. You just cannot go wrong with it! Click Here To Sign Up for M1 Finance Today!
- Best Trading Courses You Can Take For Free (or at extremely low cost): I reviewed 30+ trading courses to recommend you the best resource, and found Trading Strategies in Emerging Markets Specialization on Coursera to beat every other course on the market. Plus, if you complete this course within 7 days, it will cost you nothing and will be absolutely free! Click Here To Sign Up Today! (If you don’t find this course valuable, you can cancel anytime within the 7 days trial period and pay nothing.)
- Best Passive Investment Platform For Exponential (Potentially) Returns: By enabling passive investments into a Bitcoin ETF, Acorns gives you the best opportunity to make exponential returns on your passive investments. Plus, Acorns is currently offering a $15 bonus for simply singing up to their platform – so that is one opportunity you don’t want to miss! (assuming you are interested in this platform). Click Here To Get $15 Bonus By Signing Up For Acorns Today! (It will take you less than 5 mins to sign up, and it is totally worth it.)
Conclusion
Candlestick trading patterns form excellent tools for technical analysis, and using them can help you gain a competitive edge in the market.
Understanding how to use the patterns is, therefore, the key. This is because it allows you to interpret potential market trends and make decisions based on those inferences. If used properly, these trading patterns can be a powerful tool in your trading arsenal.
BEFORE YOU GO: Don’t forget to check out my latest article – ‘Exploring Social Trading: Community, Profit, and Collaboration’. I surveyed 1500+ traders to identify the impact social trading can have on your trading performance, and shared all my findings in this article. No matter where you are in your trading journey today, I am confident that you will find this article helpful!
Affiliate Disclosure: We participate in several affiliate programs and may be compensated if you make a purchase using our referral link, at no additional cost to you. You can, however, trust the integrity of our recommendation. Affiliate programs exist even for products that we are not recommending. We only choose to recommend you the products that we actually believe in.
Recent Posts
Exploring Social Trading: Community, Profit, and Collaboration
Have you ever wondered about the potential of social trading? Well, that curiosity led me on a fascinating journey of surveying over 1500 traders. The aim? To understand if being part of a trading...
Ah, wine investment! A tantalizing topic that piques the curiosity of many. A complex, yet alluring world where passions and profits intertwine. But, is it a good idea? In this article, we'll uncork...