Developed by Ralph Nelson Elliott in the 1930s, Elliott Wave Theory remains one of the least known tools to predict market movement using investor psychology. It’s also controversial – some consider it accurate while others argue otherwise. But does Elliott Wave Theory really work?
Elliott Wave Theory reliably predicts market movement. Several empirical studies and investors have discovered that it’s an accurate tool for a profitable trading strategy. However, you must have an in-depth understanding of the patterns, label the waves correctly, and make the right decisions.
Read on for a detailed description of this theory, understanding how to interpret its patterns, and learning how to improve its accuracy.
IMPORTANT SIDENOTE: I surveyed 1500+ traders to understand how social trading impacted their trading outcomes. The results shocked my belief system! Read my latest article: ‘Exploring Social Trading: Community, Profit, and Collaboration’ for my in-depth findings through the data collected from this survey!
Table of Contents
What Is Elliott Wave Theory?
To understand Elliott Wave Theory, let’s first review two of its critical elements: momentum and the fractal nature of price action.

Momentum
Momentum is the rate of change in a financial security’s price. In essence, a stock’s momentum shows the strength of its trend. Investors use momentum to buy shares in an uptrend and sell them in a downtrend.
Notably, a high momentum indicates how fast stock prices are moving in an upward or downward direction. When the momentum dwindles, prices start to move sideways.
Simply put, when market players share the same sentiments about a stock, its price will strongly move towards one direction (impulsive momentum).
Contrarily, when they have opposing views, prices neither move up nor down easily. This creates a choppy sideways movement (corrective momentum).
Fractal Nature of Price Action
In Elliot wave analysis, the word fractal means a series of waves that subdivides into ever-smaller sub-waves.
In other words, fractals can be smaller and similar to the original wave or they can repeat a series of patterns in different sizes.
Example: A real-life example of a fractal would be an ocean shoreline because it repeats itself on multiple scales (i.e., the pattern at one scale resembles the pattern at larger scales). The same goes with Elliot Wave Theory — as you zoom out from any position within an impulsive wave, you will see that there are repeating patterns going on which allow analysts to predict market movements based on these repeating trends.
The Basics of Elliott Wave Theory
Elliott Wave Analysis is based on the idea that the prices of financial securities move in repetitive patterns, depending on investor perceptions. Notably, the theory assumes that herd mentality dominates the market—the decisions of a large group of investors affect how individuals think and act.
Therefore, predominant psychology tends to shape price trends. This occurs repetitively as investors’ sentiments change with time, creating fractal patterns or waves. Analysts and traders can study these waves to determine the appropriate entry and exit points.
According to this theory, an impulse wave is usually characterized by a rise in a stock’s price or market activity. Conversely, the corrective phase is usually characterized by the decline of stocks in response to an increase during the impulsive phase followed by another push up which triggers more falls, and so on.
These patterns repeat at even smaller scales, with one large impulsive wave comprising five smaller waves.
This figure shows the patterns of Elliott Waves. These waves resemble those you’d see moving up the shoreline. The impulsive phase (1 through 5) shows a series of advancing waves that alternate with receding ones. The corrective phase (A through C) follows after that.
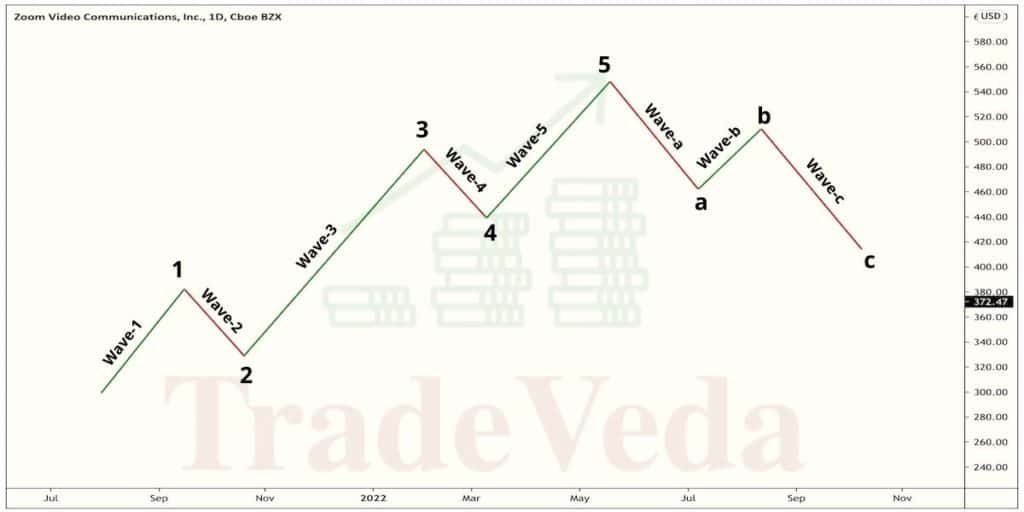
Impulsive Phase
- Wave 1: This part is hard to interpret and rarely obvious. It’s often accompanied by negative news since the previous trend’s strength hasn’t diminished completely. You should expect low earnings estimates, bearish sentiments, negative economic forecasts, and moderate-to-high volatility at this stage.
- Wave 2: It’s a corrective wave during which the economic forecast is still negative and bearish news is dominant. However, things start to look better during the second wave. It’s critical to note that this wave can’t surpass the starting point of Wave 1.
- Wave 3: It’s considered the most powerful except in commodities markets, where Wave 5 is usually the largest. At this point, most of the news is positive, prices are rising, and the effect of the previous trend has almost diminished completely.
- Wave 4: This is the second corrective wave during which prices tend to move sideways and trade volumes tend to decrease. Although it may appear stagnant, things get back to normal once this stage ends.
- Wave 5: This is the last wave in the direction of the impulsive momentum. At this stage, news and sentiments tend to be bullish, but the trade volume is lower than that of Wave 3.
Corrective Phase
- Wave A: Usually characterized by positive news. At this stage, analysts are yet to discover that there is a correction. Volumes tend to increase while prices remain stable at this point.
- Wave B: Prices reverse at a higher point, creating a false impression that the bull market is still continuing. However, trading volumes are usually lower than those in Wave A.
- Wave C: This indicates the start of the bear market. It’s as big as Wave A and is characterized by increasing volumes.
Although the chart gives an overview of the market cycles, these phases can occur at ever smaller scales, as I mentioned earlier. For instance, between Waves 1 and 2, there are several 1 through 5 and A through C waves, and so on, creating a fractal cycle.
For more information on this theory, I recommend reading Visual Guide to Elliott Wave Trading by Wayne Gorman and Jeffrey Kennedy from Amazon.com. It’s an in-depth and easy-to-read guide that blends theory with practice, making it ideal for traders, analysts, and students.
Is Elliott Wave Analysis Accurate?
Although most critics of Elliott Wave Theory argue that it doesn’t work, they don’t provide any evidence to prove their claims.
On the contrary, several studies have proven that this type of analysis is accurate. For instance, in a study, titled – ‘Fibonacci Retracement and Elliot Waves to Predict Stock Market Prices: Evidence from Amman Stock Exchange Market’, the researcher established that Elliot Wave Analysis accurately predicts price movements. In another study, titled – ‘The Effectiveness of the Elliott Waves Theory to Forecast Financial Markets: Evidence from the Currency Market’, the authors reach a similar conclusion.
In a nutshell, if executed properly, Elliot wave analysis can predict price movements with accuracy. However, to gain a substantial advantage using this method, you need to analyze the patterns and label them accurately. A sloppy analysis can lead to incorrect predictions, making you conclude that the theory doesn’t work.
In my opinion, the reason some traders argue that this theory doesn’t work is that it’s complex – I think you only need in-depth understanding and proper interpretation of the patterns to make gains using this method.
Wave analysis enables you to identify potential price directions, offering an overview of the market. By knowing where the price is, you can define your targets and stop loss, and predict trends. This can greatly help you in making sound investment decisions.
Limitations of Wave Analysis
Although it’s accurate and works, Elliott Wave Theory comes with several limitations, including:
- Requires a thorough understanding. It’s easy to mislabel patterns if you can’t discern the subtle differences, especially the corrective ones since they’re more complex.
- It’s not a sure-fire strategy. Despite the theory’s effectiveness, there’s always a chance of an alternative scenario playing out and disrupting trends.
- It requires aid. Wave analysis alone doesn’t provide a detailed overview of the market. To make better predictions, you need to use other technical analysis tools, such as moving averages and momentum indicators in conjunction with the theory. I also recommend using fundamental analysis to gain deeper insights into the intrinsic value of stocks.
Author’s Recommendations: Top Trading and Investment Resources To Consider
Before concluding this article, I wanted to share few trading and investment resources that I have vetted, with the help of 50+ consistently profitable traders, for you. I am confident that you will greatly benefit in your trading journey by considering one or more of these resources.
- Roadmap to Becoming a Consistently Profitable Trader: I surveyed 5000+ traders (and interviewed 50+ profitable traders) to create the best possible step by step trading guide for you. Read my article: ‘7 Proven Steps To Profitable Trading’ to learn about my findings from surveying 5000+ traders, and to learn how these learnings can be leveraged to your advantage.
- Best Broker For Trading Success: I reviewed 15+ brokers and discussed my findings with 50+ consistently profitable traders. Post all that assessment, the best all round broker that our collective minds picked was M1 Finance. If you are looking to open a brokerage account, choose M1 Finance. You just cannot go wrong with it! Click Here To Sign Up for M1 Finance Today!
- Best Trading Courses You Can Take For Free (or at extremely low cost): I reviewed 30+ trading courses to recommend you the best resource, and found Trading Strategies in Emerging Markets Specialization on Coursera to beat every other course on the market. Plus, if you complete this course within 7 days, it will cost you nothing and will be absolutely free! Click Here To Sign Up Today! (If you don’t find this course valuable, you can cancel anytime within the 7 days trial period and pay nothing.)
- Best Passive Investment Platform For Exponential (Potentially) Returns: By enabling passive investments into a Bitcoin ETF, Acorns gives you the best opportunity to make exponential returns on your passive investments. Plus, Acorns is currently offering a $15 bonus for simply singing up to their platform – so that is one opportunity you don’t want to miss! (assuming you are interested in this platform). Click Here To Get $15 Bonus By Signing Up For Acorns Today! (It will take you less than 5 mins to sign up, and it is totally worth it.)
Conclusion
Elliott Wave Theory is one of the rarely used technical analysis tools given its complexities and the need to have a thorough understanding of the waves. As a result, there’s a misconception that the theory is inaccurate and can’t generate profits.
However, academic studies and veteran traders have proven that this method works if used correctly. You need to understand the concepts behind it to make profitable decisions. Moreover, you should combine it with other techniques from technical and fundamental analysis to have a detailed overview of the market and to predict prices better.
BEFORE YOU GO: Don’t forget to check out my latest article – ‘Exploring Social Trading: Community, Profit, and Collaboration’. I surveyed 1500+ traders to identify the impact social trading can have on your trading performance, and shared all my findings in this article. No matter where you are in your trading journey today, I am confident that you will find this article helpful!
Affiliate Disclosure: We participate in several affiliate programs and may be compensated if you make a purchase using our referral link, at no additional cost to you. You can, however, trust the integrity of our recommendation. Affiliate programs exist even for products that we are not recommending. We only choose to recommend you the products that we actually believe in.
Recent Posts
Exploring Social Trading: Community, Profit, and Collaboration
Have you ever wondered about the potential of social trading? Well, that curiosity led me on a fascinating journey of surveying over 1500 traders. The aim? To understand if being part of a trading...
Ah, wine investment! A tantalizing topic that piques the curiosity of many. A complex, yet alluring world where passions and profits intertwine. But, is it a good idea? In this article, we'll uncork...