Keltner Channels and Bollinger Bands are both technical indicators that are used in technical analysis to measure volatility in the price of an asset. Both these indicators can be used to identify the buying and the selling opportunities in the market, but is one indicator more effective than the other?
Which of these two volatility indicators provides more accurate insights for making trading decisions? The Bollinger Bands Indicator is more popular and has a higher adoption rate than the Keltner Channels Indicator. This is driven by the fact that the Bollinger Bands are more sensitive to market volatility and therefore produce more accurate trading signals.
Hence, if you are looking for more trading opportunities using these indicators, the Bollinger Bands Indicator will better suit your purpose.
That being said, there are trading scenarios in which it would make more sense to use Keltner Channels. These specific scenarios will be identified later in this article, based on the findings of some research papers that are publicly available.
Now, before we move into the ideal usage scenarios for both each of these indicators, let us first understand what both these indicators are and how these are calculated.
IMPORTANT SIDENOTE: I surveyed 1500+ traders to understand how social trading impacted their trading outcomes. The results shocked my belief system! Read my latest article: ‘Exploring Social Trading: Community, Profit, and Collaboration’ for my in-depth findings through the data collected from this survey!
Table of Contents
What is the Keltner Channels Indicator?
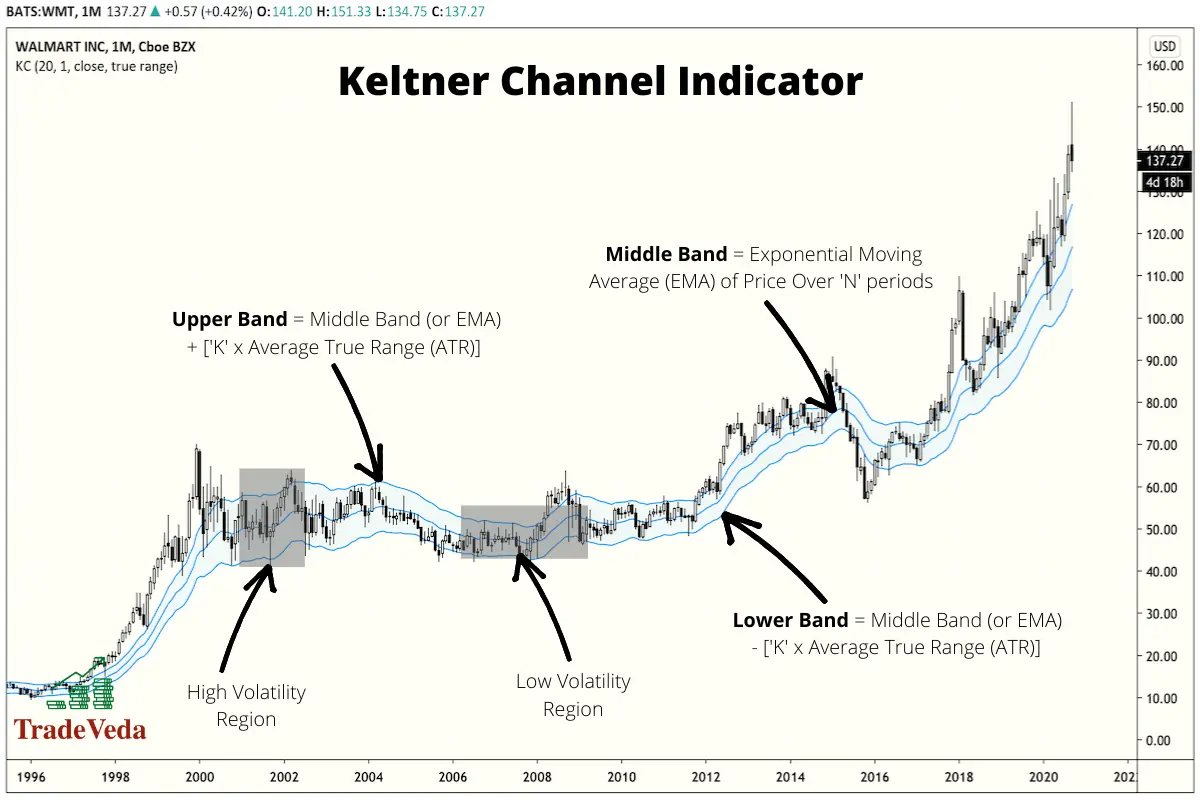
The Keltner Channel is a chart indicator used in technical analysis that measures the volatility in the price of an asset over a measured duration of time. This indicator is composed of three different lines. These are –
Middle Line
- The middle line of the Keltner Channel Indicator calculates and represents the exponential moving average (EMA), over the selected period, for the price of an asset.
- The exponential moving average (EMA) has a skewness towards the more recent price changes, and therefore it is more sensitive to recent price changes than a simple moving average
Upper Line
- The upper line of the Keltner Channel connects the price points that are double the average true range, above the EMA or the Middle Line.
Lower line
- The lower line of the Keltner Channel connects the price points that are double the average true range, below the EMA or the middle line.
In essence, the term “Keltner Channel” is used to describe the structure that the 3 lines, described above, form when they are plotted on the price chart of an asset. These lines move up and down along the y-axis that represents the price of a security. In a way, this movement is similar to what you would see with a river or stream, with the upper line and lower line mimicking the banks of the stream.
When the exponential moving average (EMA) or the middle line of the channel moves outside the bounds of the channel (the upper Line or the lower Line), this movement can be interpreted as a signal for an upcoming change or acceleration in the direction of the trend.
What is the Bollinger Bands Indicator?
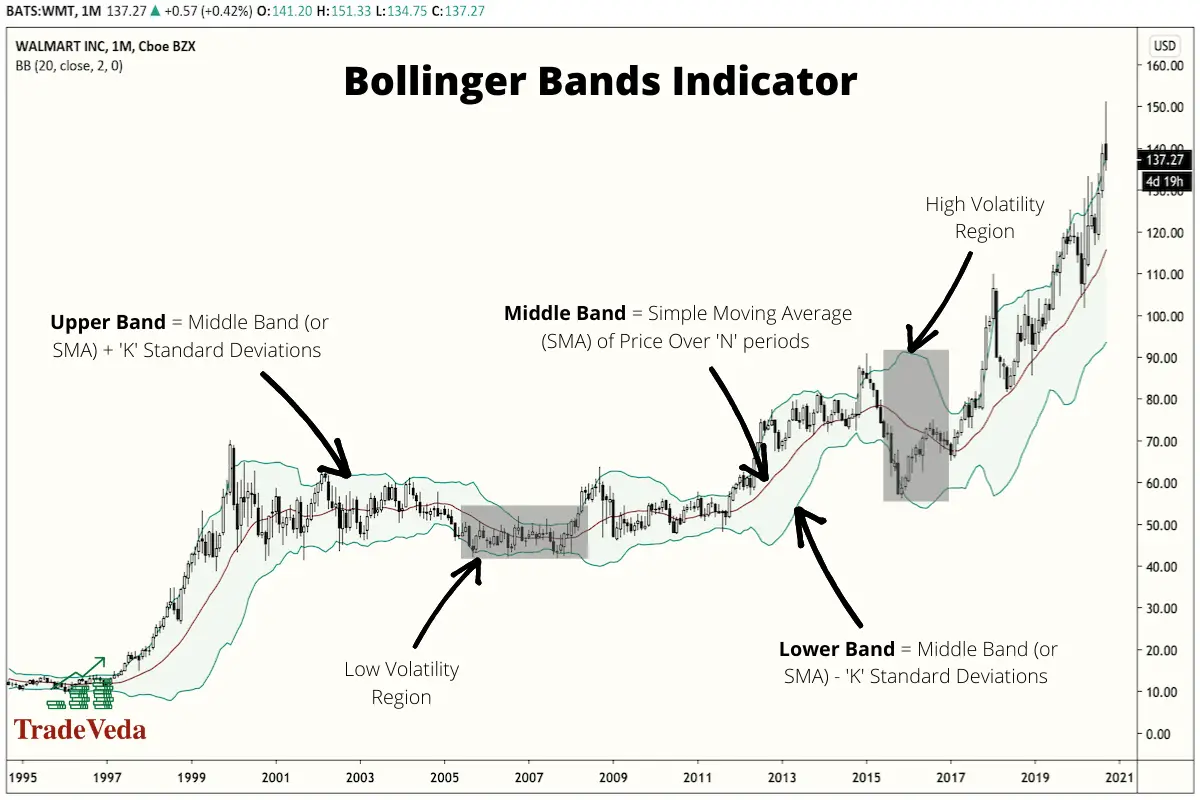
The Bollinger Bands Indicator is another volatility indicator that is widely used in technical analysis. At the face value, from the standpoint of appearance, both Bollinger Bands and Keltner Channels look alike. Similar to the Keltner Channels Indicator, the Bollinger Bands Indicator also comprise of three lines.
The three lines that when combined together create the Bollinger Bands Indicator are listed as follows –
Middle Line
- The middle line of the Bollinger Bands Indicator calculates and represents the simple moving average (SMA) for the price of an asset over the duration selected in indicator settings.
- Unlike the exponential moving average (EMA), a simple moving average (SMA) is NOT skewed towards the more recent price changes. Hence, it is relatively less sensitive to the recent price changes.
Upper Line
- The upper line of the Bollinger Bands Indicator connects the price points that are 2 standard deviations (under standard indicator settings) above the simple moving average, plotted by the middle line.
Lower Line
- The lower line of the Bollinger Bands Indicator connects the price points that are 2 standard deviations (under standard indicator settings) below the simple moving average, plotted by the middle line.
When the upper line and the lower line of the indicator drift away from each other, resulting in an expansion of the Bollinger Band, you can conclude that the volatility in the market is increasing. On the other hand, when there is a contraction in the indicator resulting due to the movement of the upper line and the lower line towards each other, it is an indication that the volatility in the market is reducing.
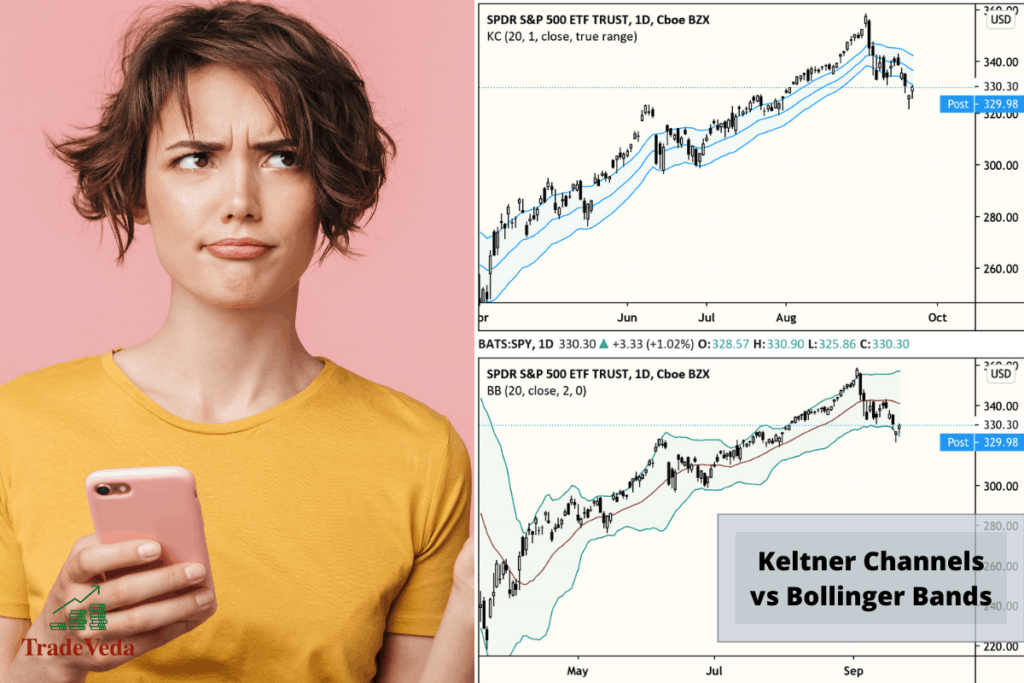
Comparison: Keltner Channels and Bollinger Bands
As you would know, there is no one indicator in technical analysis that can be universally adopted in all trading conditions or for all trading purposes.
Therefore, the technical indicator that you choose to incorporate in your trading strategy will depend largely on the specific insights that you are looking to extract. Hence, based on your requirements, you will find scenarios in which Bollinger Bands are preferable to Keltner Channels and vice versa.
High level, there are two major differences between the Keltner Channels and the Bollinger Bands. These are –
- The outer lines of the Keltner Channel are based on the average true range (ATR) of price fluctuations. Whereas, the outer lines of the Bollinger Bands Indicator are based on the standard deviation of price fluctuations.
- The middle line of the Keltner Channel Indicator is based on the exponential moving average (EMA). Whereas, the middle line of the Bollinger Bands Indicator is based on the simple moving average (SMA).
Now, you will find plenty of market conditions where it’s ideal to trade based on the standard deviation of price fluctuations versus the average true range, and vice-versa. Accordingly, your indicator of choice would vary.
That being said, I would strongly recommend that you should almost never make trading decisions based on signals from any one indicator. Incorporating various complementary indicators in your trading strategy will give you a broader perspective on the market psychology, and consequently result in better trading outcomes.
In 2010, Kaunas University of Technology published a study on the use of Bollinger Bands in the Baltic Stock Market that made a similar recommendation based on a series of statistical tests. There are a variety of complementary indicators that when used in conjunction with each other provide you with a better read on the market situation, and help with timing your buying and selling decisions.
Let us now discuss a few scenarios in which the Bollinger Bands will prove to be a better indicator than the Keltner Channels, and vice-versa.
Bollinger Bands are Better at Analyzing Short-Term Trends
Bollinger Bands are quicker at responding to short-term or more recent fluctuations in price in comparison to the Keltner Channels. For that reason, a number of previously conducted studies have found the Bollinger Bands to be the indicator of preference in making trading decisions based on short-term price fluctuations.
There are two main ways in which you can analyze the short-term price fluctuations using the Bollinger Bands. These are –
- By checking the location of the security price with respect to the upper and the lower lines of the Bollinger Bands indicator, you can get a fair idea on the momentum of the price trend.
- The broadness of the Bollinger Bands can signal the emergence of a new trend. You can anticipate major changes to the trend when the distance between the upper and lower band begins to narrow down.
That being said, there is no universal response to the results of this indicator. Some investors aim to buy securities when the price drops beyond the lower band and sell as soon as the price travels upwards from the moving average. Others will buy when the price exceeds the upper band and sell as soon as the price drops below the lower band.
Hence, how you incorporate the signals from Bollinger Bands will completely be dependent on your overall trading strategy.
Bollinger Bands Indicator Provides Better Read on Market Volatility
The Bollinger bands are more sensitive to market volatility. If a trader uses the Keltner channel in a high volatility market environment, they might miss out on numerous trading signals.
For this reason, several studies have shown that Bollinger Bands are often used by those who are looking to sell options. Options traders look for times when the upper and lower bands of the Bollinger Bands Indicator are far apart for a short time. This indicates that it is a good time to sell an option as the volatility is high.
Similarly, options traders using volatility measurement as the primary trading signal tend to buy options when the upper and lower bands of the Bollinger bands are close together. Under this strategy, options traders hope to book some profit when the volatility in price gets back to average values.
Keltner Channels Provide More Reliable Trading Signals for Long-term Trading in High Volatility Markets
Bollinger Bands are more volatile than Keltner channels because their outer bands are based on standard deviation rather than the average true range. For this reason, in a high volatility market environment, for longer-term trading, Keltner Channels are LESS likely to give a false trading signal.
Numerous studies, including one published by MQL5, have statistically tested this theory and found Keltner Channels to fluctuate less often than the Bollinger Bands in a high volatility market environment. Consequently, as stated above, Bollinger Bands have a greater potential than Keltner Channels for producing false signals.
For this reason, many traders in the energy markets, which are known to be more volatile in nature, prefer to use Keltner Channels over Bollinger Bands.
Bollinger Bands are Better Suited to Find Overbought and Oversold Securities
In 2010, a team of researchers from the Manonmaniam Sundaranar University published a study that measured the effectiveness of various data mining techniques in forecasting the future performance of the stock market. In this study, researchers found Bollinger Bands to be very effective in identifying the overbought and the oversold conditions in the stock market.
Hence, with this statistical evidence in place, it is safe to say that you should choose the Bollinger Bands Indicator over the Keltner Channels Indicator when your purpose is to identify the Overbought and the Oversold conditions in the market.
In overbought conditions, excessive buying of a security has pushed its trading price so high that it is anticipated that the security’s price will see a decline soon. Overbought conditions are identified in the Bollinger bands indicator as prices approach or exceed the indicator’s upper band.
In oversold conditions, excessive selling of a security has pushed its trading price so low that the price is anticipated to bounce back to a higher level soon. Oversold conditions are identified in the Bollinger Bands Indicator as prices approach and fall below the indicator’s lower band.
Both Bollinger Bands and Keltner Channels Should Not Be Used in Isolation
If you have read any other articles from me, you would know how strongly I stress on not relying 100% on any one technical indicator or technical analysis concept. Irrespective of what indicator or what concept (such as – Support and Resistance, etc.) you choose, you must always complement it with other confirmation signals for optimum results.
To stress a bit more and to highlight the significance of this point, I will use the findings of another interesting study that I found in my research for this article.
In 2007, Camillo Lento and Nikola Gradojevic from Lakehead University published a paper titled “The Profitability Of Technical Trading Rules: A Combined Signal Approach” in the Journal of Applied Business research.
In this paper, Lento and Gradojevic studied the effectiveness of delivering profitable trades for various technical indicators and the broader concepts in technical analysis. Based on this research, Lento and Gradojevic found that the Bollinger Bands Indicator is not more profitable than a naive buy-and-hold method unless it was paired with other complementary approaches to analyze trades. Similar observations were made for the other technical indicators/concepts – such as the Moving Average Crossover Rule, Head and Shoulders Pattern, Range Breakouts, etc. – that were included in the study.
Author’s Recommendations: Top Trading and Investment Resources To Consider
Before concluding this article, I wanted to share few trading and investment resources that I have vetted, with the help of 50+ consistently profitable traders, for you. I am confident that you will greatly benefit in your trading journey by considering one or more of these resources.
- Roadmap to Becoming a Consistently Profitable Trader: I surveyed 5000+ traders (and interviewed 50+ profitable traders) to create the best possible step by step trading guide for you. Read my article: ‘7 Proven Steps To Profitable Trading’ to learn about my findings from surveying 5000+ traders, and to learn how these learnings can be leveraged to your advantage.
- Best Broker For Trading Success: I reviewed 15+ brokers and discussed my findings with 50+ consistently profitable traders. Post all that assessment, the best all round broker that our collective minds picked was M1 Finance. If you are looking to open a brokerage account, choose M1 Finance. You just cannot go wrong with it! Click Here To Sign Up for M1 Finance Today!
- Best Trading Courses You Can Take For Free (or at extremely low cost): I reviewed 30+ trading courses to recommend you the best resource, and found Trading Strategies in Emerging Markets Specialization on Coursera to beat every other course on the market. Plus, if you complete this course within 7 days, it will cost you nothing and will be absolutely free! Click Here To Sign Up Today! (If you don’t find this course valuable, you can cancel anytime within the 7 days trial period and pay nothing.)
- Best Passive Investment Platform For Exponential (Potentially) Returns: By enabling passive investments into a Bitcoin ETF, Acorns gives you the best opportunity to make exponential returns on your passive investments. Plus, Acorns is currently offering a $15 bonus for simply singing up to their platform – so that is one opportunity you don’t want to miss! (assuming you are interested in this platform). Click Here To Get $15 Bonus By Signing Up For Acorns Today! (It will take you less than 5 mins to sign up, and it is totally worth it.)
Conclusion
Bollinger Bands and Keltner Channels are technical indicators that are used to measure the volatility of the price of an asset. Technical traders from all markets (including – stocks, Forex, cryptocurrencies, etc.) are known to include these indicators into their overall trading strategy, and these are counted among the most popular indicators in technical analysis.
Over the last several years, multiple statistical studies and research papers have been published to understand the effectiveness of both these indicators in different market environments. By consolidating the findings of these studies, it can be concluded that both these indicators have their own strengths, and depending on your trading objective and the market conditions, your ideal choice of indicator will vary. In certain trading scenarios, you would choose the Bollinger Bands, while in other scenarios you will choose the Keltner Channels.
That being said, it is important to remember that you should always use the signals from such technical indicators as just one component within your overall trading strategy. It is almost never a good idea to make trading decisions purely based on the signals from any one indicator.
BEFORE YOU GO: Don’t forget to check out my latest article – ‘Exploring Social Trading: Community, Profit, and Collaboration’. I surveyed 1500+ traders to identify the impact social trading can have on your trading performance, and shared all my findings in this article. No matter where you are in your trading journey today, I am confident that you will find this article helpful!
Affiliate Disclosure: We participate in several affiliate programs and may be compensated if you make a purchase using our referral link, at no additional cost to you. You can, however, trust the integrity of our recommendation. Affiliate programs exist even for products that we are not recommending. We only choose to recommend you the products that we actually believe in.
Recent Posts
Exploring Social Trading: Community, Profit, and Collaboration
Have you ever wondered about the potential of social trading? Well, that curiosity led me on a fascinating journey of surveying over 1500 traders. The aim? To understand if being part of a trading...
Ah, wine investment! A tantalizing topic that piques the curiosity of many. A complex, yet alluring world where passions and profits intertwine. But, is it a good idea? In this article, we'll uncork...
