The Moving Average Convergence Divergence (MACD) and the Relative Strength Index (RSI) are both momentum indicators. In essence, both these indicators are designed to provide foresight into when the price of a security can be expected to increase or decrease at an exceeding pace.
But, is one of these momentum indicators known for delivering better results in trading than the other? Statistical studies have shown that the RSI Indicator tends to deliver a higher success rate in trading than the MACD Indicator. This is largely driven by the fact that the RSI Indicator gives fewer false trading signals than MACD. That being said, there are specific trading scenarios in which the MACD can prove to be a better indicator.
Now, before getting into the trading scenarios in which you should choose one indicator versus the other, let us briefly understand what both these indicators are.
Further in the article, we will summarize the findings of several statistical studies and research papers that will help you objectively determine which indicator is likely to perform better depending on the market condition that you are trading in.
IMPORTANT SIDENOTE: I surveyed 1500+ traders to understand how social trading impacted their trading outcomes. The results shocked my belief system! Read my latest article: ‘Exploring Social Trading: Community, Profit, and Collaboration’ for my in-depth findings through the data collected from this survey!
Table of Contents
What is MACD Indicator?
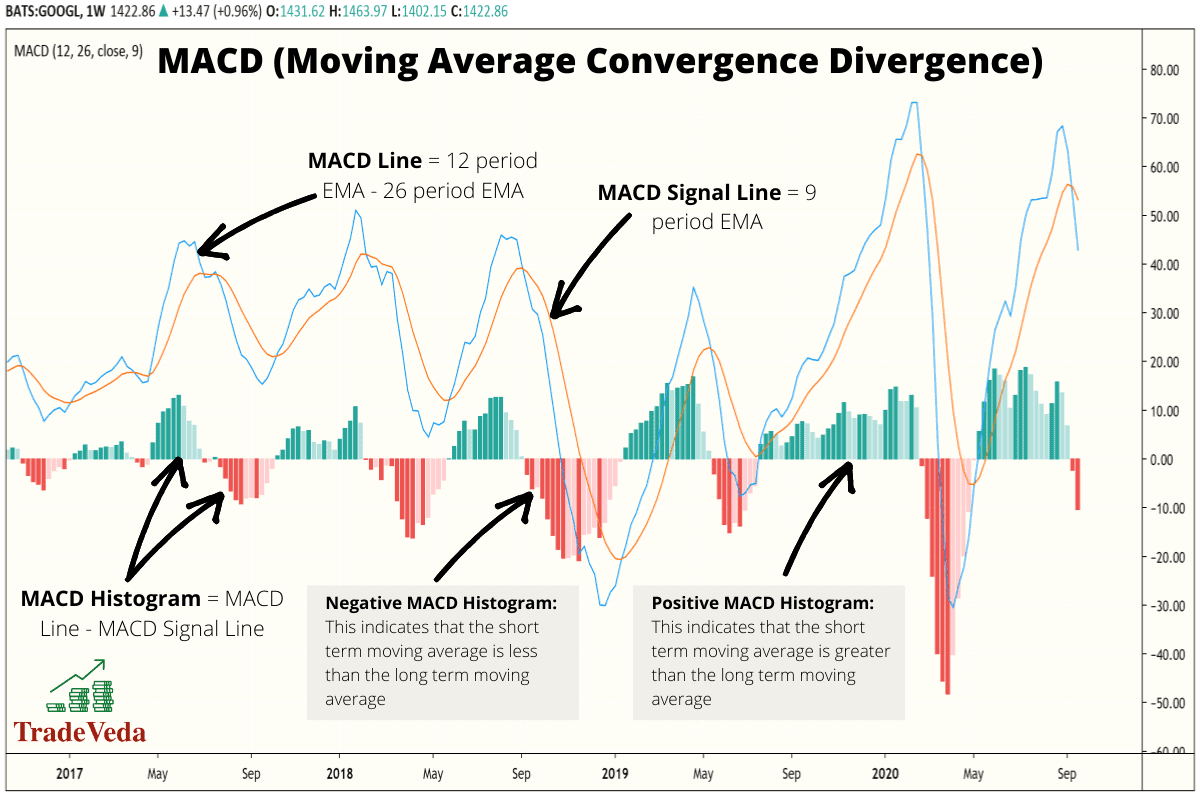
MACD stands for Moving Average Convergence Divergence. At its core, this indicator is the graphical representation of the difference between 2 different exponential moving averages, plotted against a centerline.
With standard indicator settings, the MACD shows the difference between the 12-period exponential moving average and the 26-period exponential moving average. The period of the two moving averages will depend on the time frame you are trading. If you are trading the Daily chart, then under standard indicator setting MACD will generate output using 12-day and 26-day exponential moving averages.
The default indicator settings work fine in most trading scenarios, and it will only be in very rare scenarios that you will need to make any changes to them. In fact, according to a paper published by the University of California, Berkeley, the majority of technical traders use MACD with standard indicator settings of 12-period and 26-period moving average.
Momentum is the parameter being measured by the MACD Indicator. Hence, this indicator will give you an idea of current price momentum by comparing it with the short-term and long-term price momentum.
There are few additional points worth noting on the insights provided by the MACD Indicator. These are –
- The signal line in MACD is created using a 9-period exponential moving average (EMA) or the small-period EMA, in the case where standard indicator setting is not used.
- A positive MACD shows that the short term moving average is greater than the long term moving average. This arrangement suggests an upward momentum.
- Similarly, a negative MACD represents that the long term moving average is greater than the short term moving average. This arrangement suggests a downward momentum.
- In a more volatile market, to get trading signals based on more recent trends, you should change the indicator settings to use shorter-term moving averages.
What is RSI Indicator?
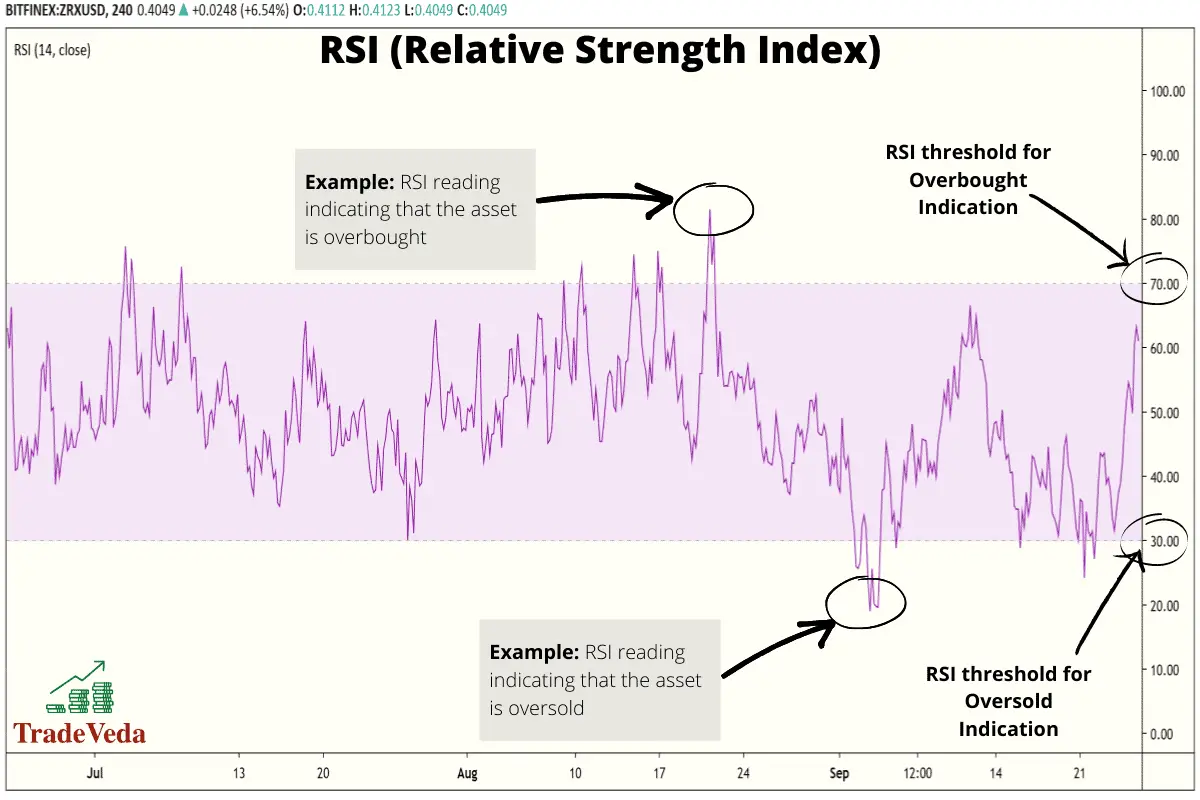
Similar to MACD, the Relative Strength Index (RSI) is another momentum indicator. According to a paper published by the University of California, Berkeley, most investors use the RSI Indicator to identify overbought and oversold conditions in the market. Hence, by using this indicator, you can find out whether the hype around a stock or any other security is for real.
The RSI Indicator is plotted on a scale of values from 0 to 100.
- A reading greater than 70 on the RSI indicates that the asset you are trading is overbought.
- A reading less than 30 on the RSI indicates that the asset you are trading might be oversold.
It has also been suggested that a reversal could be on the way if the actual price action is diverging from the RSI signal. In Technical Analysis, this concept is called divergence. In my personal trading journey, I have found divergence to be a very reliable tool in identifying upcoming trend reversals.
With standard indicator settings, the RSI is typically plotted using 14 trading periods worth of data. Similar to MACD, even for RSI the exact period for which the indicator would analyze data will depend on the time frame in which you are trading. If you are trading the daily chart, the indicator will get plotted using 14 days worth of data. Similarly, if you are trading the hourly chart, the indicator will get plotted using data worth 14 hours.
Additionally, similar to MACD, the analysis period for RSI can also be adjusted to a shorter-term period, when trading in a more volatile market. This will ensure that the signals generated by RSI are based on the most recent price trends, thereby reducing the number of false short-term signals that the indicator would otherwise generate in high volatility market environment.
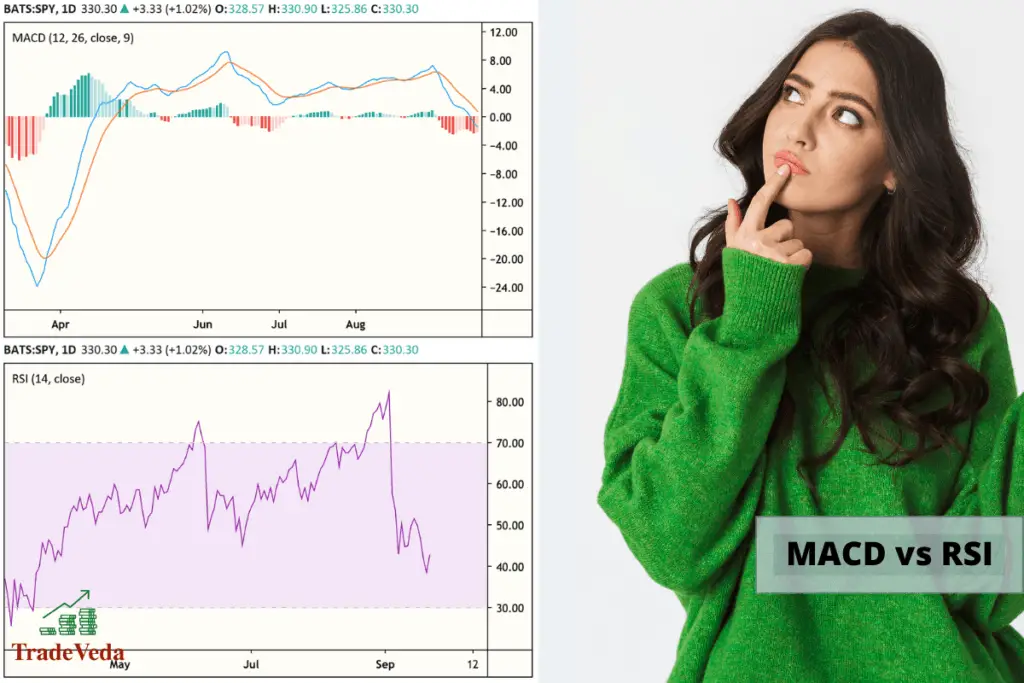
Comparison: MACD (Moving Average Convergence Divergence) and RSI (Relative Strength Index)
Even though both, MACD and RSI, are momentum indicators that measure the strength of a trend, there are some striking differences in how advanced traders use these indicators in their trading strategy.
There are scenarios in which RSI (Relative Strength Index) has been found to deliver better trading results than MACD (Moving Average Convergence Divergence) and vice versa.
In the following sections, I have summarized the findings of several statistical studies and research papers to identify scenarios in which each of these indicators has been found to have an edge over the other.
Now, without further ado, let us dive straight into these trading scenarios.
MACD Provides Trading Signals with 80% Accuracy in Trending Markets
In 2018, the Worcester Polytechnic Institute conducted a study that was aimed at developing a trend following trading strategy. During the course of this study, researchers found that the MACD is more suitable for predicting trends of large-cap and small-cap stocks in comparison to the mid-cap stocks that generally have a less organized trend line.
Statistically speaking, in this study, the MACD Indicator was able to accurately predict trend directions 80% of the time, as long as the stock was for a large-cap or small-cap company.
From a classification standpoint, in this study, a company was categorized as a large-cap company if its market capitalization value was greater than $10 billion. On the other hand, this study identified a company as a small-cap if its market capitalization value was under $1 billion.
Now, based on the findings of this research, if we were to make a deduction on the overall usability of MACD, we can conclude that this indicator is statistically NOT proven to work well in choppy markets that are characterized with a sideways movement.
Hence, if you were trading in a trending market, you can have MACD as your indicator of choice. However, in a choppy sideways movement, you are likely to get better trading results using RSI.
MACD is More Versatile, Providing Reliable Trading Signals on All Time-Frames and in a Variety of Market Conditions
In 2013, Ziba Habibilashkary, who at the time of writing this article is a Professor at the Universidad Politécnica de Madrid, published a research paper titled – “Technical analysis of Forex by MACD Indicator”.
In this paper, she examined the usefulness of MACD in Forex Trading and found this indicator to have multiple applications due to its accuracy over both short and long term periods. The MACD Indicators work well on all time frames, including the daily, weekly, and monthly time frames.
Additionally, with MACD, the divergence of the two moving averages may be altered from 12 and 26 day period EMAs to a divergence that is more suitable for a specific security.
As an example, for longer-term trade signals, if you can use longer moving averages in MACD settings it will smooth out the short to medium term volatility from indicator signals. This is especially helpful in scenarios where you are trading an asset that is known to be more volatile. This is because when your intention is to make a long-term trade on a volatile asset, you would want to “smooth out” the trading signals in order to reduce the chance of false signals. In other words, in doing this, you are zooming out in order to get a better picture of when to buy and sell the securities.
Similarly, for shorter-term trade signals when trading highly volatile assets, you may want to use smaller moving averages in MACD to generate signals that are based on most recent trends. This will ensure that you are making trading decisions based on the most recent market data and that your signals are less skewed by outliers in the longer time frame.
MACD Is Better Suited For Short-Selling Securities
A 2014 study by Business Perspective examining the effectiveness of the RSI and MACD indicators in the Australian market suggests that the MACD indicator is better suited for short-selling, in comparison to RSI. In this study, the researchers go on to cite previous studies in American and Japanese markets that further support this claim.
That being said, as a trader you must always remember that short-selling in itself comes with increased risk. Plus, in many asset classes, short selling is not an easy proposition for average traders.
For example, in the Stock Market, short selling of shares involves four steps. These are –
- First, the trader interested in taking a short trade, borrows shares from an investment firm.
- Second, the trader sells these borrowed shares to a different investor.
- Next, the trader buys back the shares that were sold to return them to the investment firm. This is the stage at which short sellers book their profits.
- Finally, the trader returns the repurchased shares back to the investment firm from which the shares were initially borrowed.
Hence, depending on the asset you are trading, short selling can be a complicated process.
But, if you are an advanced trader and you do decide to take a short position, there is statistical evidence indicating that you are likely to find better results relying on the MACD Indicator rather than the RSI Indicator.
RSI Gives Less Frequent, But More Accurate Trade Signals
The 2014 study by Business Perspective, mentioned in the previous section, examined the effectiveness of the RSI and the MACD Indicator in the Australian market on many different dimensions.
One such dimension that this study focused on was the overall profitability of trades based on signals from MACD and RSI, as the capital invested per trade increased. On this measure, this study found RSI to emerge out as a better indicator than MACD. At its core, this finding stemmed from the fact that, in this study, over a specified period of time, the RSI Indicator gave fewer but more accurate trading signals than MACD.
In cases where the RSI Indicator does signal a good time to buy or sell a security, on relative terms, taking trade actions often results in a profit. This makes the RSI a more effective indicator of momentum, in terms of profit over a longer duration of time.
RSI Gives More Reliable Trading Signals In Non-Trending Markets
The 2014 study conducted by Business Perspective also suggests that the RSI Indicator is more reliable than the MACD Indicator, when used during the non-trending periods. A non-trending period is the phase on an asset’s price chart during which its price moves sideways, between a support and a resistance, pretty regularly. During this phase, there is no meaningful rise or decline in the price of the asset.
Typically, non-trending markets are riskier to trade than trending markets. But, when you do trade during this riskier market phase, as per the findings of this study by Business Perspective, the RSI Indicator will give you more reliable trading signals than the MACD Indicator.
Finally, I would also like to point out that even though this study rules in favor of the RSI indicator for trading non-trending markets, it also encourages you to pair technical analysis with fundamental analysis before making any trading decision.
Therefore, I would strongly recommend that you make both these indicators, the RSI and the MACD, just a part of your trading strategy, and don’t take trades that are purely based on trading signals from these indicators.
RSI Pairs Better With Fundamental Analysis
In 2010, a study conducted by the Sacred Heart University examined the question of whether individual investors should use technical analysis in an attempt to “beat the stock market”. In this study, several technical indicators, including the Relative Strength Index, were found to work really well in conjunction with Fundamental Analysis. Fundamental analysis techniques include looking at the current price of assets and comparing those prices to their ideal state value.
Similar to the MACD Indicator, the RSI Indicator looks for changes in the momentum of price to determine when it is a good time to buy or sell an asset. The study was unable to find a “general-rule-of-thumb” for using the RSI Indicator, even though it tested a large variety of moving average and trading ranges. However, in this study, using RSI (Relative Strength Index) in combination with Fundamental Analysis did provide some degree of profit in every scenario.
That being said, the overall conclusion of this study in reference was that technical analysis alone is insufficient in making profitable trading decisions. Just something to be aware of!
Author’s Recommendations: Top Trading and Investment Resources To Consider
Before concluding this article, I wanted to share few trading and investment resources that I have vetted, with the help of 50+ consistently profitable traders, for you. I am confident that you will greatly benefit in your trading journey by considering one or more of these resources.
- Roadmap to Becoming a Consistently Profitable Trader: I surveyed 5000+ traders (and interviewed 50+ profitable traders) to create the best possible step by step trading guide for you. Read my article: ‘7 Proven Steps To Profitable Trading’ to learn about my findings from surveying 5000+ traders, and to learn how these learnings can be leveraged to your advantage.
- Best Broker For Trading Success: I reviewed 15+ brokers and discussed my findings with 50+ consistently profitable traders. Post all that assessment, the best all round broker that our collective minds picked was M1 Finance. If you are looking to open a brokerage account, choose M1 Finance. You just cannot go wrong with it! Click Here To Sign Up for M1 Finance Today!
- Best Trading Courses You Can Take For Free (or at extremely low cost): I reviewed 30+ trading courses to recommend you the best resource, and found Trading Strategies in Emerging Markets Specialization on Coursera to beat every other course on the market. Plus, if you complete this course within 7 days, it will cost you nothing and will be absolutely free! Click Here To Sign Up Today! (If you don’t find this course valuable, you can cancel anytime within the 7 days trial period and pay nothing.)
- Best Passive Investment Platform For Exponential (Potentially) Returns: By enabling passive investments into a Bitcoin ETF, Acorns gives you the best opportunity to make exponential returns on your passive investments. Plus, Acorns is currently offering a $15 bonus for simply singing up to their platform – so that is one opportunity you don’t want to miss! (assuming you are interested in this platform). Click Here To Get $15 Bonus By Signing Up For Acorns Today! (It will take you less than 5 mins to sign up, and it is totally worth it.)
Conclusion
MACD (Moving Average Convergence Divergence) and RSI (Relative Strength Index) are both momentum indicators that are used by technical traders to understand the strength of a trend.
Technical traders from most, if not all, markets (such as – stocks, Forex, cryptocurrencies, etc.) commonly deploy signals from these indicators into their overall trading strategy.
In the last several years, multiple studies and statistical researches have analyzed the reliability of both these indicators in varying market conditions. By taking an aggregate view of the findings of these studies, it can be safely concluded that both these indicators have their own strengths, and depending on your trading objectives and market conditions, the ideal choice of indicator will vary.
RSI will prove to be the technical indicator of choice in certain trading scenarios, and MACD will have an edge over it in other trading scenarios.
That being said, signals from any single technical indicator should never form your overall trading strategy. Instead, you should use combined signals from multiple technical indicators or trading methods to enter trades. This will ensure that your trades have a high probability of success. It is almost never a good idea to make trading decisions purely based on the signals from any one indicator.
BEFORE YOU GO: Don’t forget to check out my latest article – ‘Exploring Social Trading: Community, Profit, and Collaboration’. I surveyed 1500+ traders to identify the impact social trading can have on your trading performance, and shared all my findings in this article. No matter where you are in your trading journey today, I am confident that you will find this article helpful!
Affiliate Disclosure: We participate in several affiliate programs and may be compensated if you make a purchase using our referral link, at no additional cost to you. You can, however, trust the integrity of our recommendation. Affiliate programs exist even for products that we are not recommending. We only choose to recommend you the products that we actually believe in.
Recent Posts
Exploring Social Trading: Community, Profit, and Collaboration
Have you ever wondered about the potential of social trading? Well, that curiosity led me on a fascinating journey of surveying over 1500 traders. The aim? To understand if being part of a trading...
Ah, wine investment! A tantalizing topic that piques the curiosity of many. A complex, yet alluring world where passions and profits intertwine. But, is it a good idea? In this article, we'll uncork...
