Rounding Bottom and Rounding Top are two of the most popular chart patterns in technical analysis that you can use to identify trend reversal. These patterns can be found on all time frames (for example, monthly, weekly, daily, or something more short-term), and technical traders trading a variety of asset classes (such as – stocks, Forex, cryptocurrencies, etc.) incorporate them into their overall trading strategy. If you can master the art of using these patterns to understand the market psychology, these can be instrumental additions to your overall trading strategy.
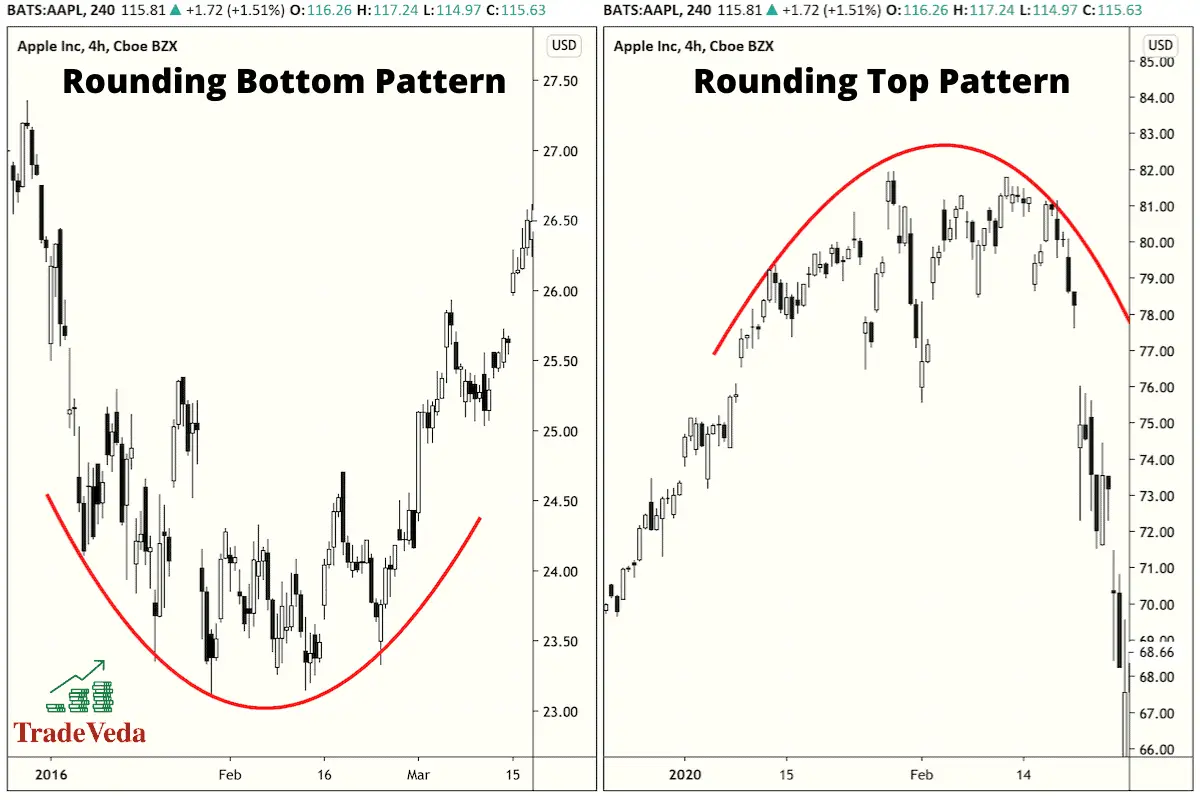
So, what really are the Rounding Bottom and Rounding Top Patterns in technical analysis? The Rounding Bottom and the Rounding Top Chart Patterns are U-shaped (and inverted U-shaped) reversal chart patterns. Both these patterns are designed to identify the end of a price trend, and technical traders use them frequently to supplement their hypothesis of an upcoming reversal in trend.
In other words, if the price is increasing, the rounding top pattern predicts that the increase in price will climax and the price will revert to the downside. On the other hand, if the price is decreasing, the rounding bottom pattern predicts that the price will hit a bottom and then revert to an uptrend.
Naturally, as with any other technical trading strategy, there is more that goes behind measuring or predicting a trend with the Rounding Bottom and Rounding Top Chart Patterns. How can they be identified? How can they be used in a trading strategy? What are their limitations, and what you can do to address these limitations? These are all examples of some commonly asked questions with regard to these patterns. Hence, let us dive deep into each of these topics in the following sections of this article.
IMPORTANT SIDENOTE: I surveyed 1500+ traders to understand how social trading impacted their trading outcomes. The results shocked my belief system! Read my latest article: ‘Exploring Social Trading: Community, Profit, and Collaboration’ for my in-depth findings through the data collected from this survey!
Table of Contents
Relationship Between Rounding Bottom and Rounding Top Chart Patterns
In principle, both the Rounding Bottom and the Rounding Top Patterns work exactly the same way. The underlying theory and the market psychology behind the formation of both these patterns are literally the same.
The two patterns operate as the inverse of each other in shape and in how you can incorporate them into your trading strategy to make informed decisions. With each pattern, your primary objective as a trader remains to identify the point at which you can expect a reversal in price or an end to the existing price trend.
Both, the Rounding Bottom and the Rounding Top, patterns appear at the end of an extended price trend and create a period of sideways movement (a movement under which the price of the asset does not move in either direction), which is followed by the reversal in the directing of the price from its initial direction.
Similarly, with both patterns, we measure the difference between the limit reached in price and the trend reversal point (identified by forming a neckline), to determine our trade entry, stop-loss target, and the take-profit target for the trade.
Each of these patterns also takes around the same amount of time to develop and are identified using the same tools of technical analysis.
Identifying Rounding Bottom and Rounding Top Chart Patterns
There are a couple of ways in which you can identify the emergence of a Rounding Bottom and a Rounding Top Pattern. These are:
- With Geometry and Shape Recognition
- With the Use of Technical Indicators and Tools
In my personal trading experience, I got the best results when I combined both these above-stated techniques for identifying the Rounding Bottom and the Rounding Top patterns.
Now, without further ado, let us dive deep into each of these two methods.
Identifying Rounding Bottom and Rounding Top Patterns Using Geometry and Shape Recognition
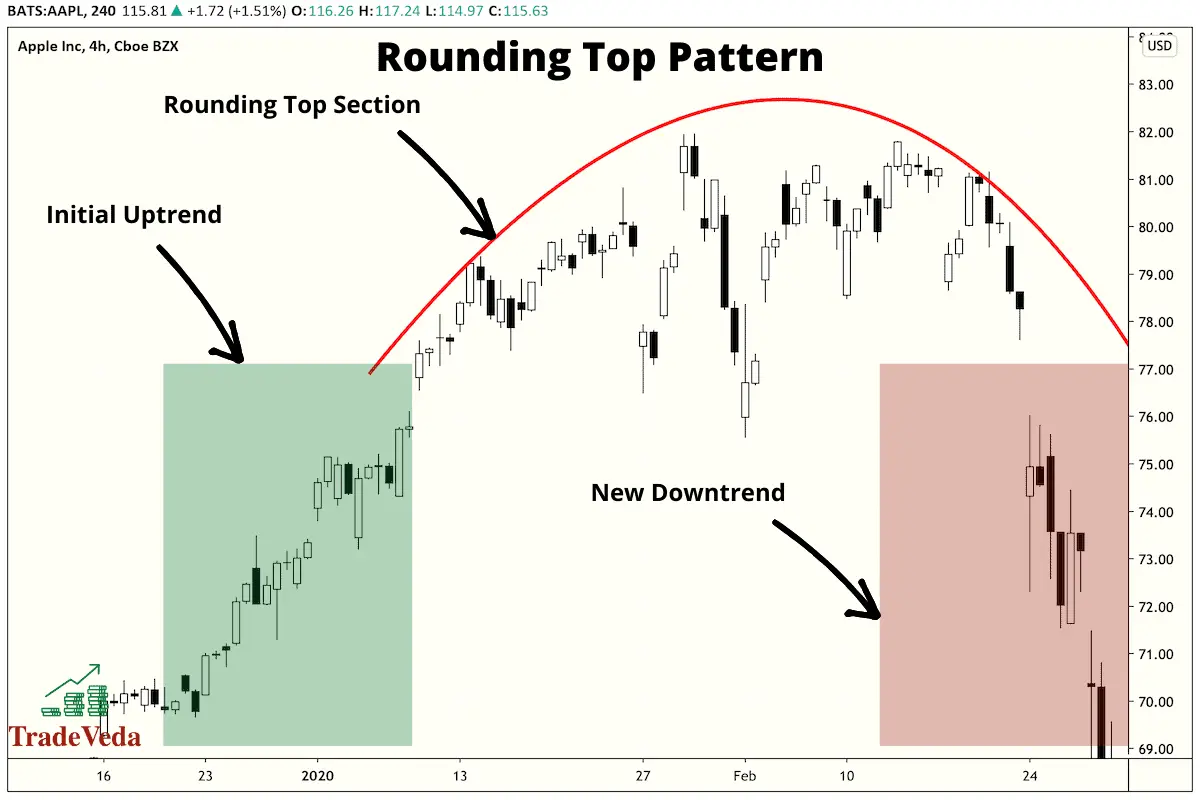
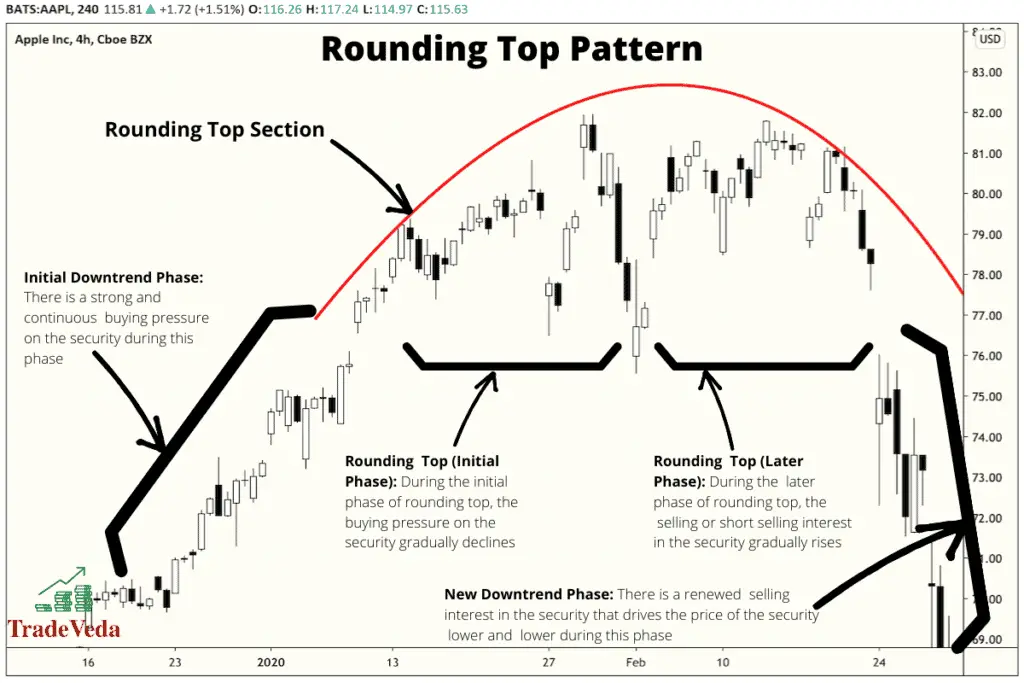
A Rounding Top Chart Pattern resembles an inverse saucer and has three main sections to it. Each of these three sections flow fluidly from one to the next. The three sections that form the Rounding Top Pattern are as follows:
- Initial Existing Uptrend: The construction of the Rounding Top pattern begins with an existing uptrend. Post successful completion of this reversal pattern, it is this uptrend that will come to an end.
- Rounding Top Section: The initial uptrend is followed up with a section that displays slowness in price increase or momentum. This slowness in price increase slowly tapers off, thereby making the rounding top portion.
- New Downtrend: This is the final section in the construction of the Rounding Top Pattern. Post the tapering of price that forms the rounding section of the pattern, there is the beginning of the new downtrend. The emergence of this new downtrend marks the successful completion of the Rounding Top Pattern.
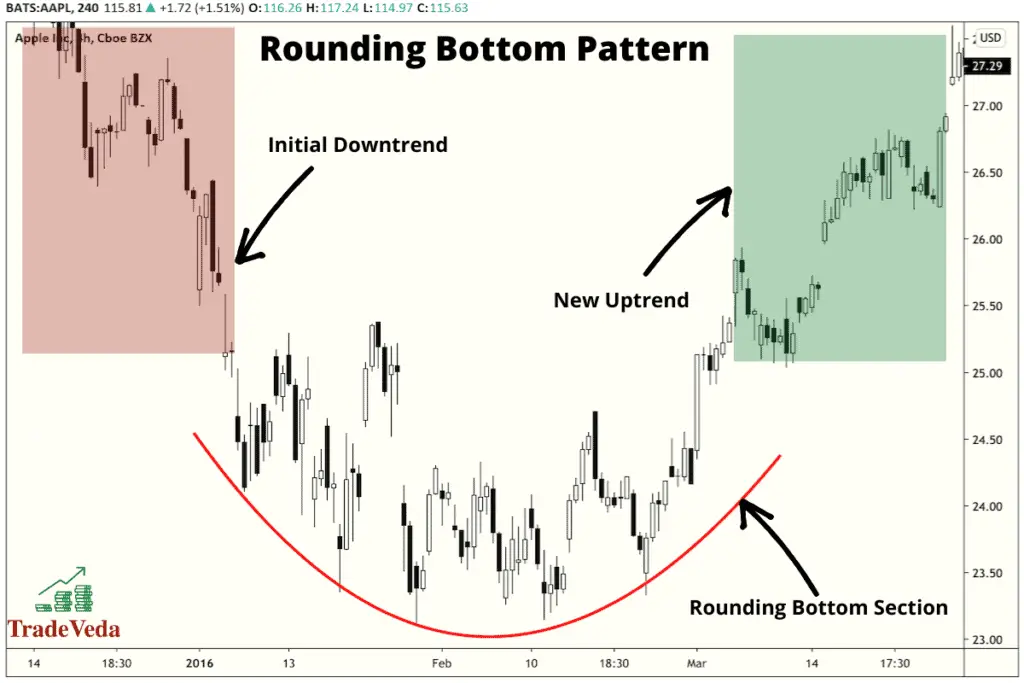
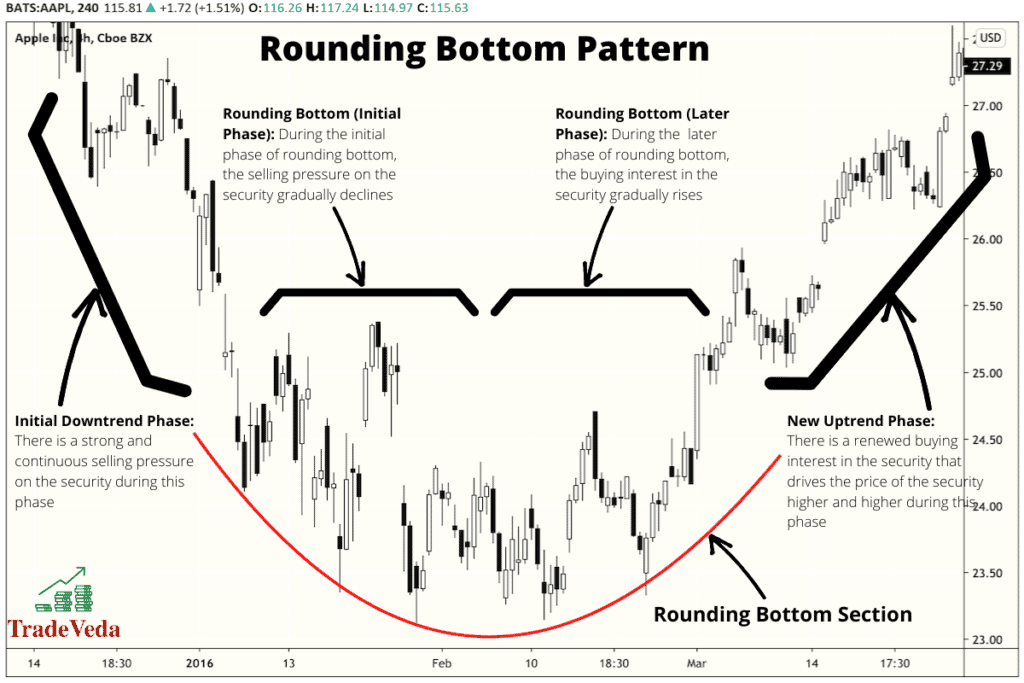
A Rounding Bottom Chart Pattern looks like the Rounding Top Chart Pattern if it was flipped horizontally. Just like its bearish counterpart, it also comprises three identifiable sections, which are listed as follows:
- Initial Existing Downtrend: Similar to the Rounding Top Pattern, the construction of this pattern is also marked by an existing trend. In the case of the Rounding Bottom Pattern, however, the initial trend that marks the beginning of the pattern is a downtrend. Post successful completion of this reversal pattern, it is this downtrend that will come to an end.
- Rounding Bottom Section: With this pattern, the initial downtrend is followed with the gradual loss in momentum of price decline. This gradual loss in momentum eventually results in the downtrend tapering off, resulting in a U shaped formation on the chart. This U shaped formation makes the rounding bottom section of the pattern.
- New Uptrend: This is the final section in the formation of the Rounding Bottom Pattern. Post the development of the U-shaped formation at the bottom, there is an emergence of a new uptrend. Successful completion of the Rounding Bottom Pattern is marked with the confirmation of this new uptrend.
Identifying Rounding Bottom and Rounding Top Patterns Using Technical Indicators and Tools
Although both these chart patterns appear to be simple, they can be a little difficult to spot without the use of some technical or chart indicators. This is because of two reasons, which are listed as follows:
- If you are trading on a timeframe that is different from the timeframe on which these patterns are really taking their geometric shape, it would be incredibly difficult for you to spot these patterns.
- Irrespective of the timeframe that you trade, the development of both these patterns can take a long time. Hence, identifying these patterns on time to make an informed trading decision can be challenging.
That being said, both these difficulties can be addressed with the use of certain technical indicators and techniques in technical analysis. Let us discuss a few of these technical methods in the following sections.
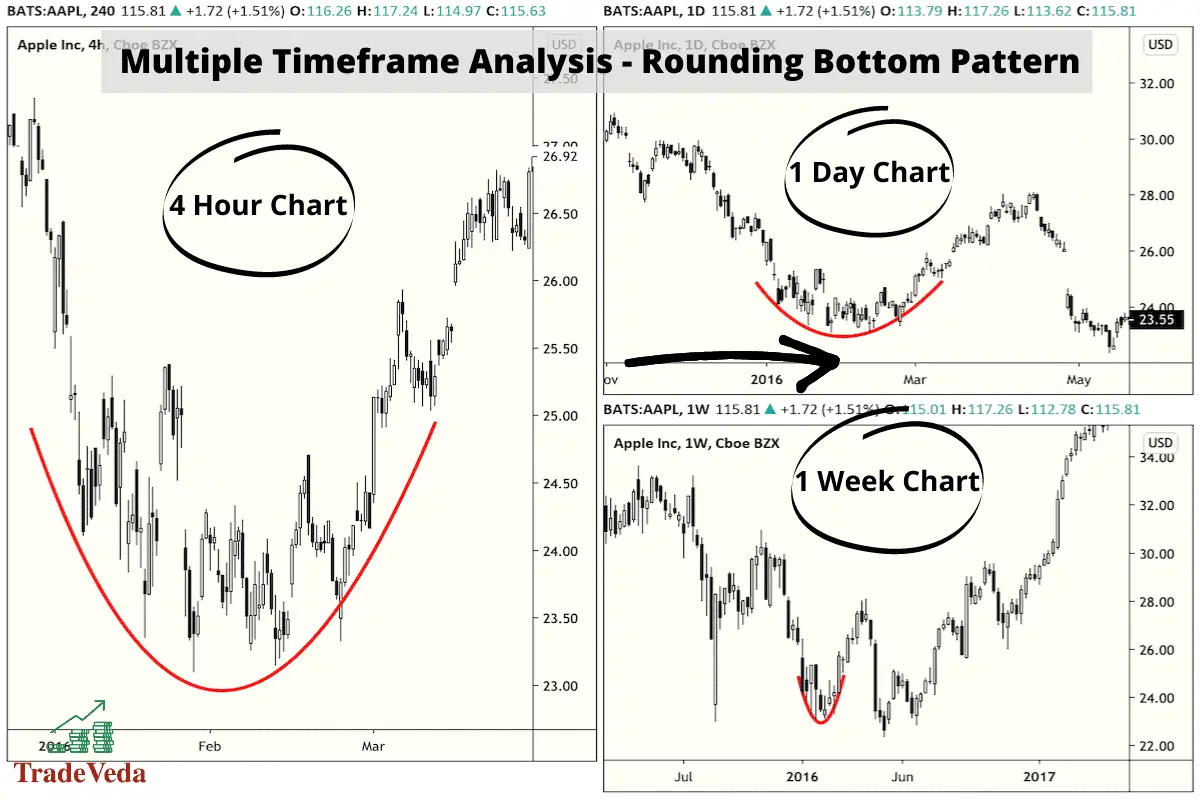
Multiple Timeframe Analysis
When you view your chart on a smaller timeframe, you may not identify the Rounding Top or the Rounding Bottom pattern that is in development on a larger time frame. Instead, you may just see only an uptrend, a downtrend, or a plateau.
Similarly, when you view your chart on a larger timeframe, you may not identify the formation of these patterns on a smaller timeframe.
Therefore, the first step you can take to better identify these patterns is to analyze the chart of the security that you are trading over multiple timeframes.
Large-Lot Tracking Indicator
To timely identify these patterns, in addition to analyzing the price chart of the asset that you are trading over multiple timeframes, it is equally important to identify trends over an extended period of time.
Using a large-lot tracking indicator to analyze the trend over a longer timeframe will enable you successfully to take this step.
The term “large-lot” here just indicates that the indicator can analyze large amounts of data over an extended period. An example of a large-lot tracking indicator is the Ease of Movement Indicator.
Trading Volume
Finally, you can leverage the trading volume of the asset as another effective indicator in identifying the emergence of the Rounding Bottom and the Rounding Top Patterns.
To identify these patterns using trading volume, you can either use volume itself as an indicator or you can also use other quantity indicators such as the On-Balance Volume Indicator (OBV). Quantity indicators such as On-Balance Volume Indicator work by compiling a huge amount of trading volume information into a single line indicator that is simpler to read and interpret.
To further expand on the use of volume in identifying these patterns, let us briefly discuss the relationship between the volume and the various phases in the development of the Rounding Bottom pattern.
- Initial Downtrend Phase: During the initial decline in the price at the beginning of the pattern formation, the chart indicates that there is an excess supply of the asset in the market. People are not buying as much, but there is a lot available. So, the pattern will start with higher volumes.
- Rounding Bottom Phase: As the market adjusts to the forces of demand and supply, the volume of the asset adjusts into a range as well. This phase is marked with a lower volume for an extended period of time.
- New Uptrend Phase: The reversal in price trend occurs when the demand begins to increase again, and it is accompanied by a spike in the volume. Therefore, similar to the initial downtrend, this phase is also marked with higher volumes.
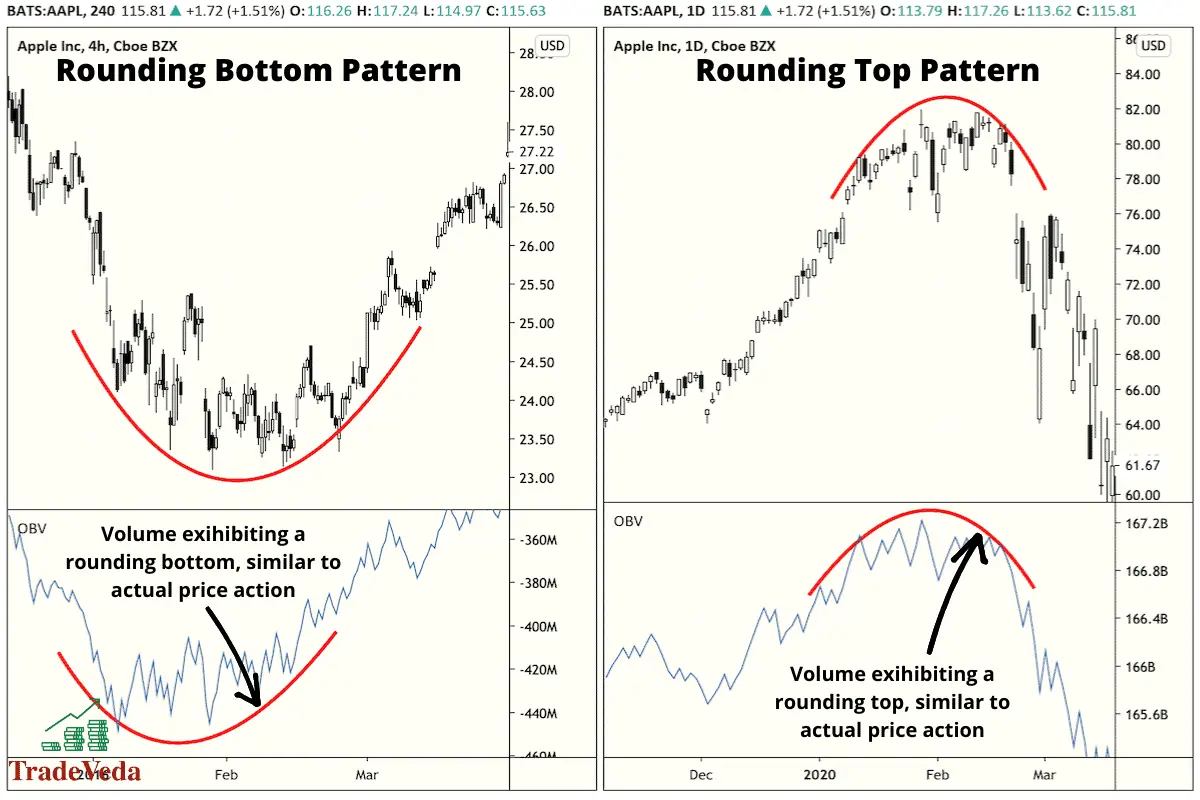
A Rounding Top Chart Pattern will exhibit the same relationship with volume during its development phase as does the Rounding Bottom. With the Rounding Top Pattern, the lowest point in the volume will correspond to the peak of the rounding top or the plateau at the top of the chart, whereas, the initial and the new trends will both be marked with a period of high volume.
So, now that we have established the relationship between the trading volume and pattern formation, how can you use this relationship in identifying these patterns? If you graph out the volumes over the period of pattern development and draw a line connecting the tops of the volume bars, it will also mirror the rounding pattern. This can be used as a confirmation for the development of the Rounding Top and the Rounding Bottom Pattern.
Interpreting Rounding Bottom and Rounding Top Chart Patterns
Now that we have discussed how to recognize the Rounding Bottom and the Rounding Top Patterns, let us spend some time in understanding the market psychology that leads to the development of these patterns.
With a thorough understanding of this market psychology, you will be better positioned to interpret the market semantics leading to these formations, and thereby make informed trading decisions using them.
To understand the psychology behind the formation of the Rounding Top and the Rounding Bottom Chart Pattern, let us briefly discuss the Principle of Demand and Supply from macroeconomics.
The Principle of Demand and Supply is at the core of the market psychology that results in the formation of the Rounding Top and the Rounding Bottom Pattern.
In simple terms, this principle states that the demand for an asset is inversely proportional to its price. This means that as the price of an asset increases, it gradually begins to lose the interest of potential buyers and vice-versa.
Now, let us discuss how this principle applies to the formation of both these patterns.
Interpreting the Rounding Top Pattern
Correctly identifying a Rounding Top Pattern can prevent you from buying into a potentially unfavorable market. In fact, by understanding the market forces behind the formation of this pattern, you can use them to your advantage short sell and profit from the loss in buying interest for the asset that you are trading.
Now, let us understand the psychology of the market during each of the three stages of this pattern’s development.
- Initial Uptrend Phase: During the initial uptrend, or the first leg of this pattern, the price of the asset that you are trading is at a level where we have enough demand for the asset. In other words, during this phase, there are buyers that are willing to pay the market price for the asset. Hence, the price of the asset continues to rise during this phase.
- Rounding Top Phase: During this phase, as the market price for the asset continues to rise, the buyers gradually start losing interest in the asset, and the momentum of price begins to decline. Additionally, as we progress further into this phase, the price of the asset reaches a point at which there are no buyers for it. From this point onwards, the price of the asset begins to gradually decline, giving this pattern its rounded shape.
- New Downtrend Phase: As the price of the asset begins to decline, the buying interest in the asset further declines. This decline in buying interest prompts more traders who are holding this asset to sell it at a lower price, giving rise to the new downtrend.
Interpreting the Rounding Bottom Pattern
The market psychology behind the formation of the Rounding Bottom pattern is similar, but inverse, to the Rounding Top pattern. The psychology of the market participants during each leg of this pattern’s formation is described as follows:
- Initial Downtrend Phase: During this initial phase of the pattern, there exists a ton of selling pressure on the assets. There are little to no buyers for the asset in the market. Hence, the price of the asset continues to decline during this phase.
- Rounding Bottom Phase: During this phase, as the price of the asset continues to fall, the buyers gradually begin to gain interest in the asset. At first, this rising interest in the asset slows the pace of its price decline, and then it results in a gradual increase in the asset’s price. These market semantics give this pattern its rounded shape.
- New Uptrend Phase: As the price of the asset continues to increase, the buying interest in it is regained. As a result, more and more buyers are now interested in the asset and are willing to pay a higher price for it. This results in the start of the new uptrend.
Improving the Reliability of Rounding Bottom and Rounding Top Patterns in Trading
The Rounding Bottom and the Rounding Top are two of the most reliable chart patterns in trading, with a low failure rate of between 3-6% and 9-12% respectively. To come to this conclusion, I used a series of backtesting data and pattern research across multiple asset classes.
That being said, this does not mean that these patterns are easy to trade. This is primarily because of two reasons –
- Reason-1: There are other chart patterns that resemble these patterns in shape. Therefore, when formulating your trading strategy around these patterns, it can be difficult to confirm them while the pattern is still under development.
- Reason-2: Even when you know for sure that it is one of these two patterns that is in development, knowing exactly when the reversal and the breakout would occur is incredibly difficult.
Due to these above-stated reasons, profiting from these patterns can be very challenging for novice traders. However, there are two ways in which you can increase the reliability of the Rounding Bottom and the Rounding Top pattern for profitable trading. These are –
- Having an Agile Trading Strategy
- Incorporating Other Technical Analysis Concepts/Indicators in Your Pattern Trading Strategy
Now, without further ado, let us dive deep into both these methods.
Having an Agile Trading Strategy
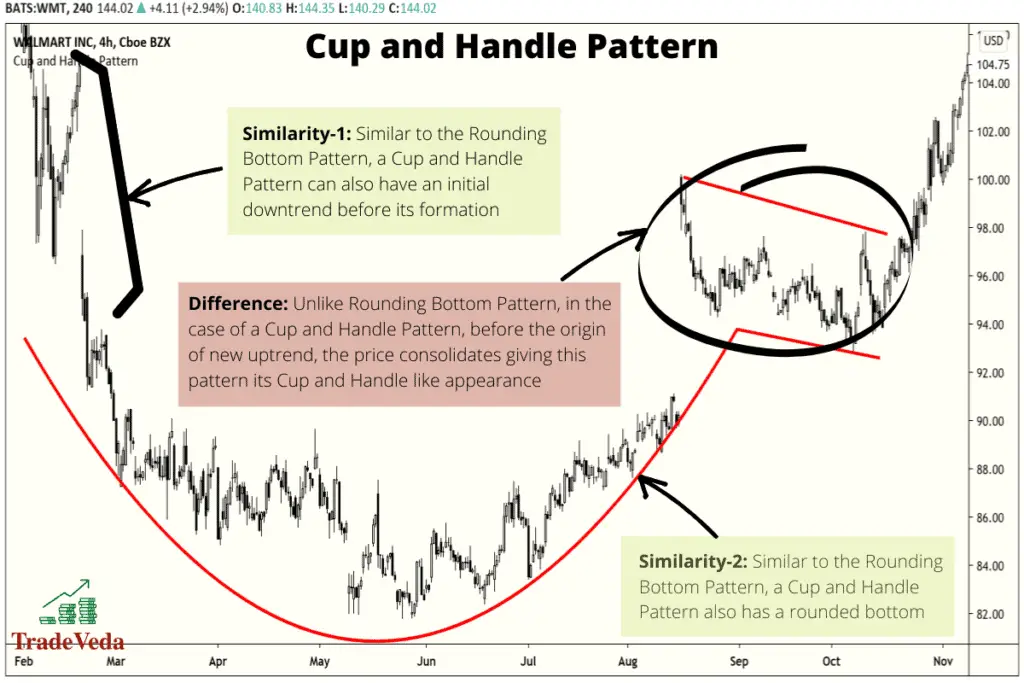
As described above, it is incredibly difficult to identify the Rounding Bottom and the Rounding Top patterns while they are still in development. This is because during the early development phases, the structure of these patterns resemble several other chart patterns. For example, the Cup and Handle and the Inverse Cup and Handle patterns resemble very close to the Rounding Bottom and the Rounding Top patterns respectively.
Therefore, it is important that you have an agile trading strategy that allows you to pivot when your pattern hypothesis is wrong. Until there is a clear indication on the development of the new trend and the formation of these patterns is confirmed, your trading plan must empower you to profit from any of the potential patterns that could be in development.
In simpler words, do not put your sole ambition on the fact that the price graph will form one of these two patterns. With an agile trading strategy, you will not miss out on a profitable trade entry even when your initial hypothesis is incorrect. Furthermore, this will minimize your risk of losing money due to a premature entry into a trade.
Incorporating Other Technical Analysis Concepts/Indicators to Your Pattern Trading Strategy
The Rounding Bottom and the Rounding Top Chart Patterns are pretty reliable when it comes to providing you with a general idea on when to expect a breakout and/or a trend reversal. However, more often than not, this general idea will not be enough for you to make a trade decision.
To integrate these patterns into your overall trading strategy and use them to enter trades, you need to have a way to identify the trade entry and exit points. Hence, your odds of trading success with these chart patterns can increase multifold, if you combine them with few other concepts/indicators in Technical Analysis to make trading decisions.
In fact, for successful trading, you must never rely on the trading signals from any one chart pattern or indicator. Your trading strategy should always combine signals from several complementary methods or tools.
Now, without further ado, let us discuss a few tools/concepts in technical analysis that can help you improve the reliability of the trading signals that you get from these chart patterns.
Several tools and concepts in Technical Analysis that can be used to improve the reliability of the Rounding Bottom and the Rounding Top patterns are as follows –
- Japanese Candlestick Patterns
- Support and Resistance
- Momentum Indicators and Divergence
- Volatility Indicators
Japanese Candlestick Patterns
I have found Japanese Candlestick Patterns to work really well with most chart patterns, including the Rounding Top and the Rounding Bottom Pattern. With these chart patterns, you can use candlestick patterns in two ways –
- Identifying Trend Reversal Zones: You can use reversal candlestick patterns to identify the potential trend reversal zones when trading the Rounding Top and the Rounding Bottom Chart Patterns. Once the pattern that you are looking to trade has matured enough that you need to identify trend reversal zones, these reversal candlestick patterns can give you some strong reversal signals.
- Breakout Confirmation: You can use continuation candlestick patterns to get confirmation on price breakouts when trading these patterns. The continuation candlestick patterns are strong indicators that the newly developed trend post-breakout will continue.
Support and Resistance
The addition of Support and Resistance in your strategy to trade the Rounding Bottom and the Rounding Top Pattern can help deliver great trading results.
The key challenges that you will encounter when trading these patterns will, for the most part, revolve around identifying the trade entry and exit points. Hence, you can leverage the concept of Support and Resistance to address these shortcomings of Support and Resistance.
To identify trading opportunities, you can leverage Support and Resistance in many forms. Personally, I have used the following types of Support and Resistance while trading chart patterns –
- Trendlines
- Pivot Points
- Horizontal Support and Resistance
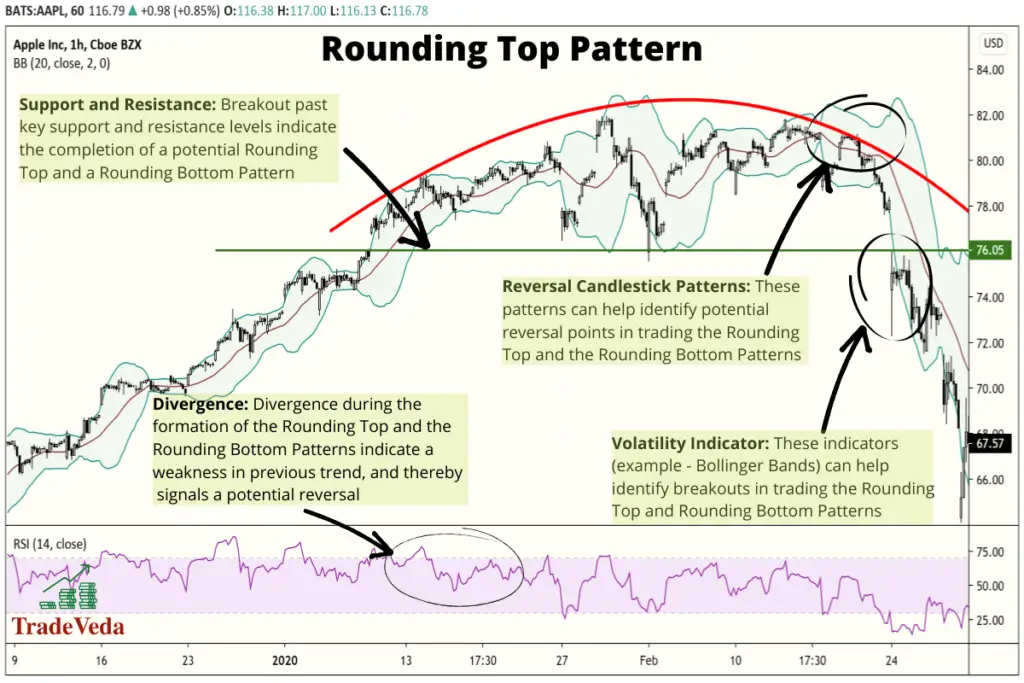
Momentum Indicators and Divergence
Momentum indicators indicate the speed of a trend and are faster at catching trend reversals than most other types of technical indicators. Coupling these indicators with the Rounding Top and the Rounding Bottom Patterns can give you a broader perspective of the market sentiment and help improve the accuracy of your predictions.
In my experience, the most effective way to integrate momentum indicators into your pattern trading strategy is to use these indicators for measuring Divergence.
Divergence is a very powerful tool in technical analysis. It provides perspective into the strength and the weakness of a trend, and can therefore be used to get early signs of an upcoming reversal and breakout.
Hence, by using momentum indicators to monitor divergence when trading these patterns, you can get a better read on the timing of the reversal and the breakout. With this edge in your trading plan, the accuracy of your trades can be sizably improved.
There are many technical indicators that you can use for checking divergence. My preferred go-to indicators for this purpose are MACD and RSI.
Volatility Indicators
Volatility Indicators are used to measure the frequency and the scale of variations in the price of an asset. In simpler words, these indicators measure how often the price of an asset changes and the scale at which these price variations occur.
When combined with the Rounding Top and the Rounding Bottom Patterns, these indicators can provide great aid in identifying the breakout points.
While there are many volatility indicators that you can combine with these chart patterns to identify breakout trades, I have personally found best results with using the Bollinger Bands and the Donchian Channels.
Trading Rounding Bottom and Rounding Top Chart Patterns
Identifying the Rounding Bottom and the Rounding Top patterns on the price chart of an asset after the fact is very easy. However, trading these patterns in real-time is not as straightforward. Therefore, it is important that you have a well-rounded and holistic trading plan before entering a trade with these patterns.
Before you venture into trading these patterns, several things are essential to note. These are:
- There must be a prior downtrend for the Rounding Bottom and a prior uptrend for the Rounding Top Pattern to develop. These are both reversal patterns, so if no trend precedes them, there is no reversal to predict.
- The chart must have some amount of symmetry in time value. The period between the left-side decline/incline and middle of the chart, and the middle of the chart and the right-side incline/decline should be close or equal.
- The pattern is not confirmed until a breakout has occurred.
Now that we have refreshed our memory with these above-listed pointers, let us dive deep into the Breakout Trading Strategy to profit from these patterns.
Trading Strategy: Breakout Trading
Breakout Trading is one of the most, if not the most, reliable and popular methods to trade the Rounding Bottom and the Rounding Top Patterns.
There four stages involved with trading the breakouts using these patterns. These are –
- Identifying Tradable Waves
- Determining Trade Entry
- Determining Stop Loss Target
- Determining Take Profit Target
Now, without further ado, let us dive deep into each of these four stages.
Identifying Tradable Waves
The breakout trading strategy focuses on getting an early trade entry in the direction of the new trend, once the Rounding Bottom or the Rounding Top Pattern is completed.
Hence, this strategy concentrates on trading anywhere along the curve after the breakout. How to identify breakouts and set profit targets will be better explained in the following sections.
Determining Trade Entry
In this strategy, you will enter a trade when the price breaks the resistance for a Rounding Bottom Pattern or the support for a Rounding Top Pattern. The breakout past the support and the resistance level indicates that the reversal will continue, and you therefore look for trading opportunities in the direction of this new trend.
- For the Rounding Bottom pattern, one way to identify the resistance is to draw a horizontal line that runs parallel to and above the bottom of the chart and marks the points at which the trend switches from a trend to a sideways, horizontal movement. Above this line, price is moving, while below it, a practically stagnant change of prices is occurring.
Once the price breaks above this horizontal line, you go long with the prediction that prices will continue to increase.
- Conversely, when trading the Rounding Top Pattern, the support can be identified as the horizontal line that runs parallel to and below the top of the chart. It again marks the points at which the price movements switch from a trending movement to a sideways or horizontal movement. Below this line, the price is moving; above it, the change in price is very little.
Once the price breaks below the support of the Rounding Top pattern, you go short with the prediction that prices will continue to decline.
NOTE: Horizontal Lines are one of the many available tools to identify the Support and Resistance levels when identifying breakout trades using these patterns. There are plenty of other techniques that you can leverage here, including the usage of Volatility Indicators such as Bollinger Bands or Donchian Channels.
Additionally, you must always wait for a confirmation signal when entering a trade post breakout.
Determining Stop-Loss Target
With this strategy, when trading the Rounding Bottom Pattern, you will put your stop-loss below the same resistance level, breakout beyond which was used as a trade entry signal.
Similarly, when trading the Rounding Top Pattern, you will put your stop-loss above the same support level, breakout beyond which was used as a trade entry signal.
Some traders like to put stop-loss exactly at the support or the resistance levels, however, I would caution against that practice. Post breakouts, it is very common for the price to retest the support and the resistance levels. Hence, by putting the stop-loss exactly at these levels, you are at the risk of being taken out of the trade in the event of such a retest.
NOTE: You must never trade without a stop-loss. These patterns are not confirmed until the breakout is successful, and false breakouts in trading are not uncommon. Therefore, having a stop-loss will protect you from unexpected losses, when the price moves against your prediction.
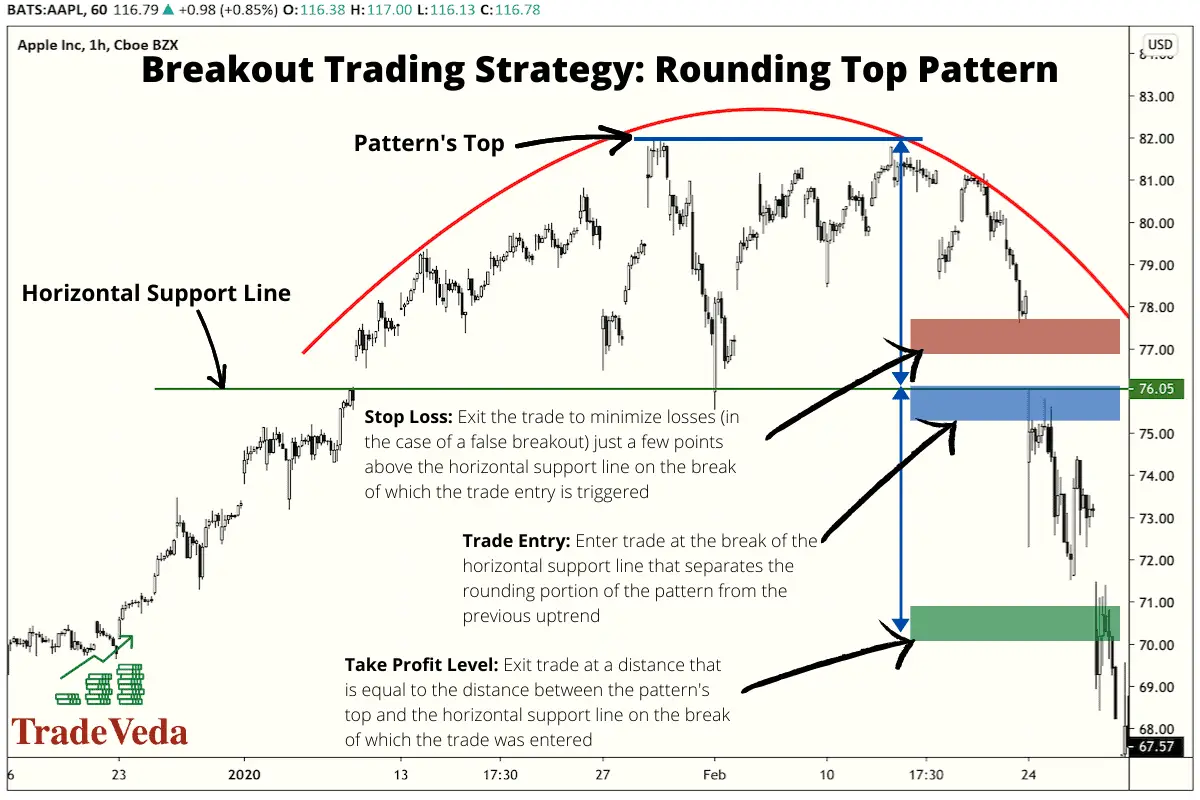
Determining Take-Profit Target
With this strategy, the take-profit target can be set using the following guidelines –
- In the case of a Rounding Top Pattern, the distance between the top and the support line is equal to the distance between the support line and the take-profit level.
- Similarly, in the case of a Rounding Bottom pattern, the distance between the bottom and the resistance line is equal to the distance between the resistance line and the take-profit level.
Hence, in this strategy, the take-profit target is calculated by first finding the distance between the price limit on your chart (by this, I mean the lowest price point for a Rounding Bottom and the highest price point for a Rounding Top) and the breakout point on your chart.
Then, you set your take-profit target at a distance from your breakout point that is equivalent to the distance calculated in the previous step.
Advantages and Limitations of Trading Rounding Bottom and Rounding Top Patterns
Similar to any other methodology in technical analysis, there are several advantages and limitations of trading the Rounding Bottom and the Rounding Top Patterns.
Listed in the following sections are some of the key advantages and the key limitations of trading these patterns.
Advantages of Trading Rounding Bottom and Rounding Top Patterns
- These patterns have been found to be highly reliable at informing trade decisions.
- These patterns are simple to understand and read through as a beginner.
- Trading these patterns can be very profitable when the pattern pulls through, and the market exhibits the behavior which was predicted.
Limitations of Trading Rounding Bottom and Rounding Top Patterns
- These patterns take a long time to develop.
- The breakout point for these patterns can be challenging to identify.
- These patterns can easily be confused with the Cup and Handle, and other similar patterns that are best traded with very different strategies.
Author’s Recommendations: Top Trading and Investment Resources To Consider
Before concluding this article, I wanted to share few trading and investment resources that I have vetted, with the help of 50+ consistently profitable traders, for you. I am confident that you will greatly benefit in your trading journey by considering one or more of these resources.
- Roadmap to Becoming a Consistently Profitable Trader: I surveyed 5000+ traders (and interviewed 50+ profitable traders) to create the best possible step by step trading guide for you. Read my article: ‘7 Proven Steps To Profitable Trading’ to learn about my findings from surveying 5000+ traders, and to learn how these learnings can be leveraged to your advantage.
- Best Broker For Trading Success: I reviewed 15+ brokers and discussed my findings with 50+ consistently profitable traders. Post all that assessment, the best all round broker that our collective minds picked was M1 Finance. If you are looking to open a brokerage account, choose M1 Finance. You just cannot go wrong with it! Click Here To Sign Up for M1 Finance Today!
- Best Trading Courses You Can Take For Free (or at extremely low cost): I reviewed 30+ trading courses to recommend you the best resource, and found Trading Strategies in Emerging Markets Specialization on Coursera to beat every other course on the market. Plus, if you complete this course within 7 days, it will cost you nothing and will be absolutely free! Click Here To Sign Up Today! (If you don’t find this course valuable, you can cancel anytime within the 7 days trial period and pay nothing.)
- Best Passive Investment Platform For Exponential (Potentially) Returns: By enabling passive investments into a Bitcoin ETF, Acorns gives you the best opportunity to make exponential returns on your passive investments. Plus, Acorns is currently offering a $15 bonus for simply singing up to their platform – so that is one opportunity you don’t want to miss! (assuming you are interested in this platform). Click Here To Get $15 Bonus By Signing Up For Acorns Today! (It will take you less than 5 mins to sign up, and it is totally worth it.)
Conclusion
To conclude, the Rounding Top and the Rounding Bottom are reversal chart patterns that are designed to speculate the ending of an existing trend, and to identify early trading opportunities in the direction of the new trend.
Trading breakouts in the direction of the new trend is where you make most profits when trading these patterns.
While it is relatively simple to trade these patterns, you must understand that irrespective of the timeframe you are trading, these patterns take time to develop. Hence, to trade these patterns successfully, you will need to display a certain level of patience in your trading strategy.
BEFORE YOU GO: Don’t forget to check out my latest article – ‘Exploring Social Trading: Community, Profit, and Collaboration’. I surveyed 1500+ traders to identify the impact social trading can have on your trading performance, and shared all my findings in this article. No matter where you are in your trading journey today, I am confident that you will find this article helpful!
Affiliate Disclosure: We participate in several affiliate programs and may be compensated if you make a purchase using our referral link, at no additional cost to you. You can, however, trust the integrity of our recommendation. Affiliate programs exist even for products that we are not recommending. We only choose to recommend you the products that we actually believe in.
Recent Posts
Exploring Social Trading: Community, Profit, and Collaboration
Have you ever wondered about the potential of social trading? Well, that curiosity led me on a fascinating journey of surveying over 1500 traders. The aim? To understand if being part of a trading...
Ah, wine investment! A tantalizing topic that piques the curiosity of many. A complex, yet alluring world where passions and profits intertwine. But, is it a good idea? In this article, we'll uncork...
