Traders leveraging technical analysis to make trading decisions rely heavily on various technical indicators. In essence, these indicators run complex mathematical computations in the background and provide you with an easy to interpret, real-time analysis on the trading price of an asset. Personally, I find technical indicators very helpful, and they play a pivotal role in my overall trading strategy.
That being said, there are so many different technical indicators to choose from that it can be overwhelming to select the indicators that would work best for your individual needs.
In this article, I will try to narrow down the options for you, by listing 13 technical indicators that I have personally found to be reliable in my 10 years of trading journey.
The 13 most reliable technical indicators that actually work in trading are as follows:
- Relative Strength Index (RSI)
- Williams Percent Range
- Stochastic Indicator
- Pivot Points
- Fibonacci Retracement and Extensions
- Parabolic SAR
- Moving Averages
- MACD
- Bollinger Bands
- Keltner Channels
- Donchian Channel
- Average Directional Index (ADX)
- Ichimoku Kinko Hyo
What do these indicators do? How do they work? What are their respective advantages and disadvantages? How do you trade with them? The answers to all these questions, and more, will be discussed in the following sections.
IMPORTANT SIDENOTE: I surveyed 1500+ traders to understand how social trading impacted their trading outcomes. The results shocked my belief system! Read my latest article: ‘Exploring Social Trading: Community, Profit, and Collaboration’ for my in-depth findings through the data collected from this survey!
Table of Contents
Relative Strength Index (RSI)
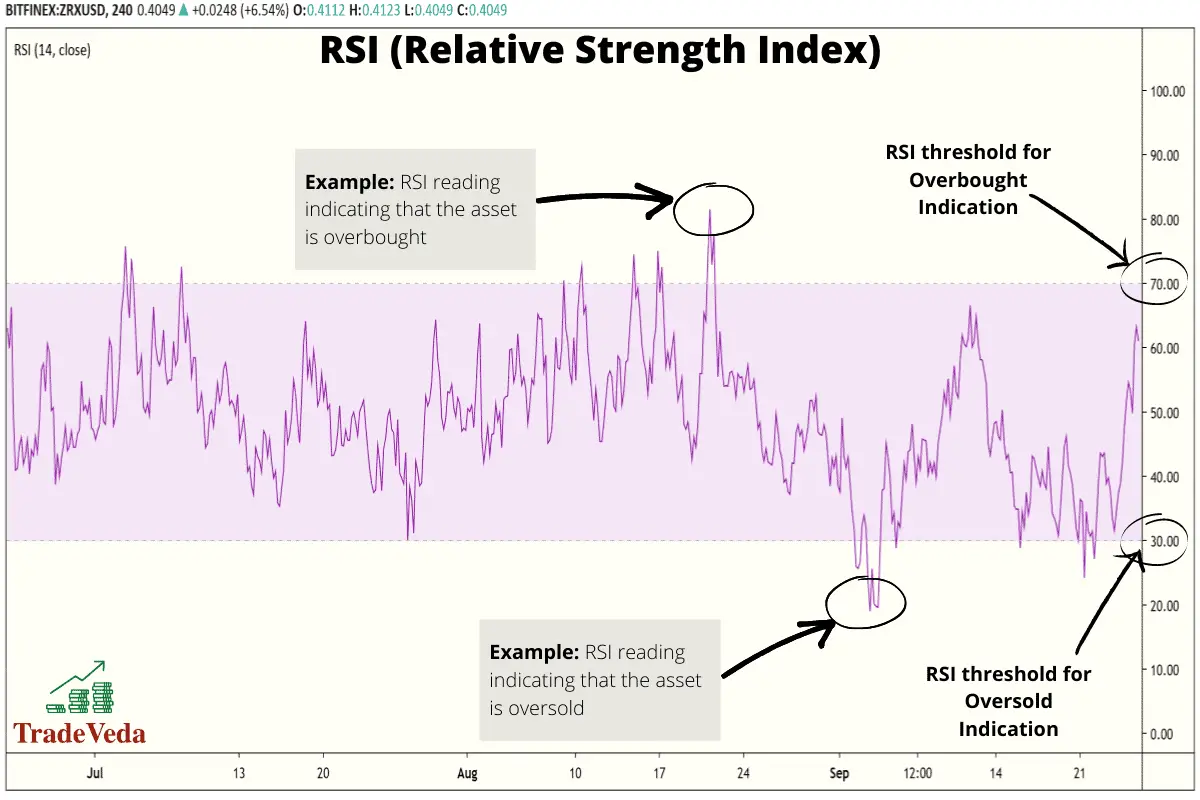
The Relative Strength Index (RSI) is a momentum indicator that measures the extent of recent price changes to evaluate how much an asset’s price may be overbought or oversold. It is displayed as a line graph that oscillates between two extremes, having a reading anywhere between 0 and 100. Usually, when the price is above 70%, the asset is considered overbought, and when the price is below 30%, it is considered oversold.
The RSI is calculated using a two-part equation:
First, the following equation is used for 14 periods to find an average gain or loss:
RSI1 = 100 – [100 / {1 + (Average Gain / Average Loss)}]
Next, this second equation is used to smooth out the information attained by the first calculations:
RSI2= 100 – [100 / {1 + ((Previous Average Gains * 13 + Current Gain) / (Average of Average Loss * 12 + Current Loss))}]
Trading with Relative Strength Index (RSI) Indicator
- When the RSI is above 70% mark, it indicates that the market is overbought. In these situations, you should look for a confirmation signal from complementary trading techniques or indicators, and sell or short sell the asset.
- When the RSI is below 30% mark, it indicates that the market is oversold. This is a buy signal, but you should wait for a confirmation signal from a complementary trading indicator or trading technique before entering the buy trade.
Advantages of Trading with Relative Strength Index (RSI) Indicator
- RSI is relatively easy to interpret and to integrate into your overall trading strategy.
Limitations of Trading with Relative Strength Index (RSI) Indicator
- RSI in itself is rarely sufficient in generating reliably trading signals. Therefore, you will always need to confirm signals from this indicator before entering a trade.
Williams Percent Range (Williams %R)
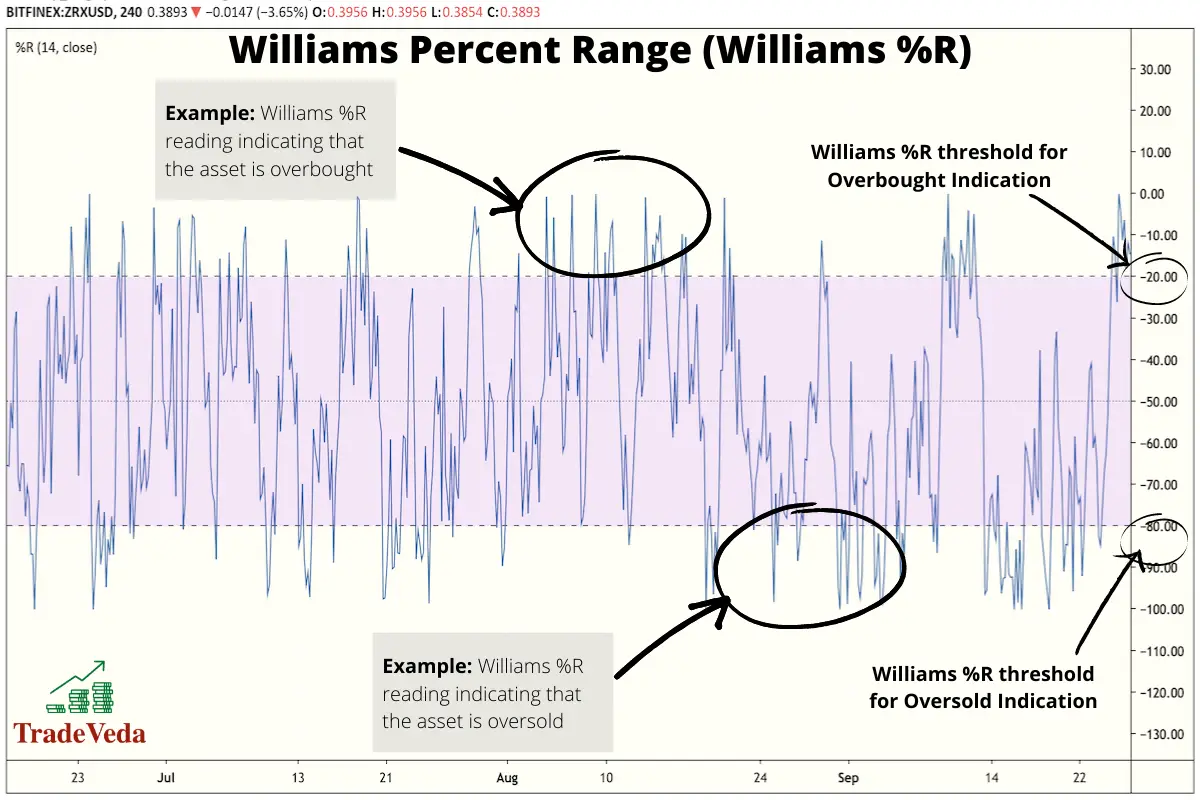
Williams Percent Range is another momentum indicator that is composed of a line that oscillates between 0 and -100, and measures whether an asset’s price is at an oversold or overbought level.
The calculation for this indicator is broken down in the equation below:
Williams %R = [(Highest High – Close) / (Highest High – Lowest Low)] x (-100)
Where:
- Highest High = the highest price in the period (typically 14 days)
- Close = the most recent closing price
- Lowest Low = the lowest price in the period
Trading with Williams Percent Range (Williams %R)
- When Williams % R is above the -20 mark, it indicates an overbought condition in the market. Hence, you can look for a sell or a short sell trade when this situation occurs.
- Contrarily, when Williams %R is below the -80 mark, it is an indication that the asset is oversold. Upon confirmation using a complementary trading method, you can enter a long trade when this happens.
Advantages of Trading with Williams Percent Range (Williams %R)
- Signals from William %R are very straightforward and easy to interpret.
- In combination with other complementary trading techniques, this indicator can sizably improve the reliability of your trades.
Limitations of Trading with Williams Percent Range (Williams %R)
- As a standalone indicator, William % R is not very reliable for making trading decisions.
Stochastic Indicator (Stochastic Oscillator)
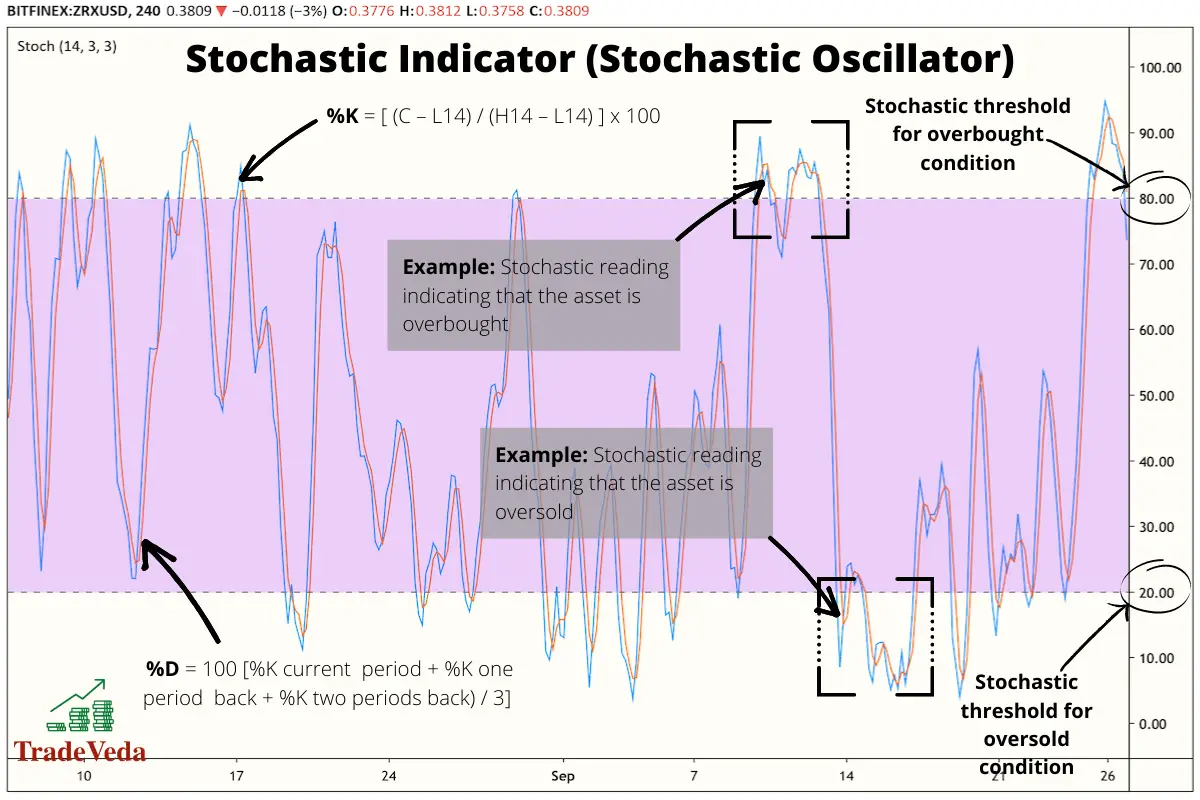
The stochastic indicator is another momentum indicator, similar to RSI and Williams %R, that compares the closing price of an asset (a security) to the range of prices resulting from its movement over a specified period. Occasionally, advanced traders adjust the period of analysis for this indicator to increase or decrease its sensitivity.
The results of the calculations that go into forming this indicator are translated into two line, %K and %D, that oscillates between a 0 and 100 bounded range, similar to other momentum indicators.
The formula of the stochastic indicator is given by the following equation:
%K = [(C – L14) / (H14 – L14)] x 100
Where:
- C = the most recent closing price
- H14 = the highest price traded over 14 days
- L14 = the lowest price traded over the same 14-day period
%D = [(%Kcurrent period + %K -1 period +%K -2 periods) / 3] x 100
Where:
- %Kcurrent period = %K reading for the current trading session
- %K-1 period = %K reading for the previous trading session
- %K-2 period = %K reading for the trading session before previous session
Trading with Stochastic Indicator (Stochastic Oscillator)
- When using a Stochastic Indicator, buy when the market is oversold (indicator reading is above 70%).
- When using a Stochastic Indicator, sell or short sell when the market is oversold (indicator reading is below 30%).
Advantages of Trading with Stochastic Indicator (Stochastic Oscillator)
- With a Stochastic Indicator, it is easy to see the momentum of price trends in the market.
Limitations of Trading with Stochastic Indicator (Stochastic Oscillator)
- The Stochastic Indicator is not meant to be used on its own as it does not provide enough information for you to make a confident trade. It is best used to confirm a trend coupled with various volatility indicators.
Pivot Points
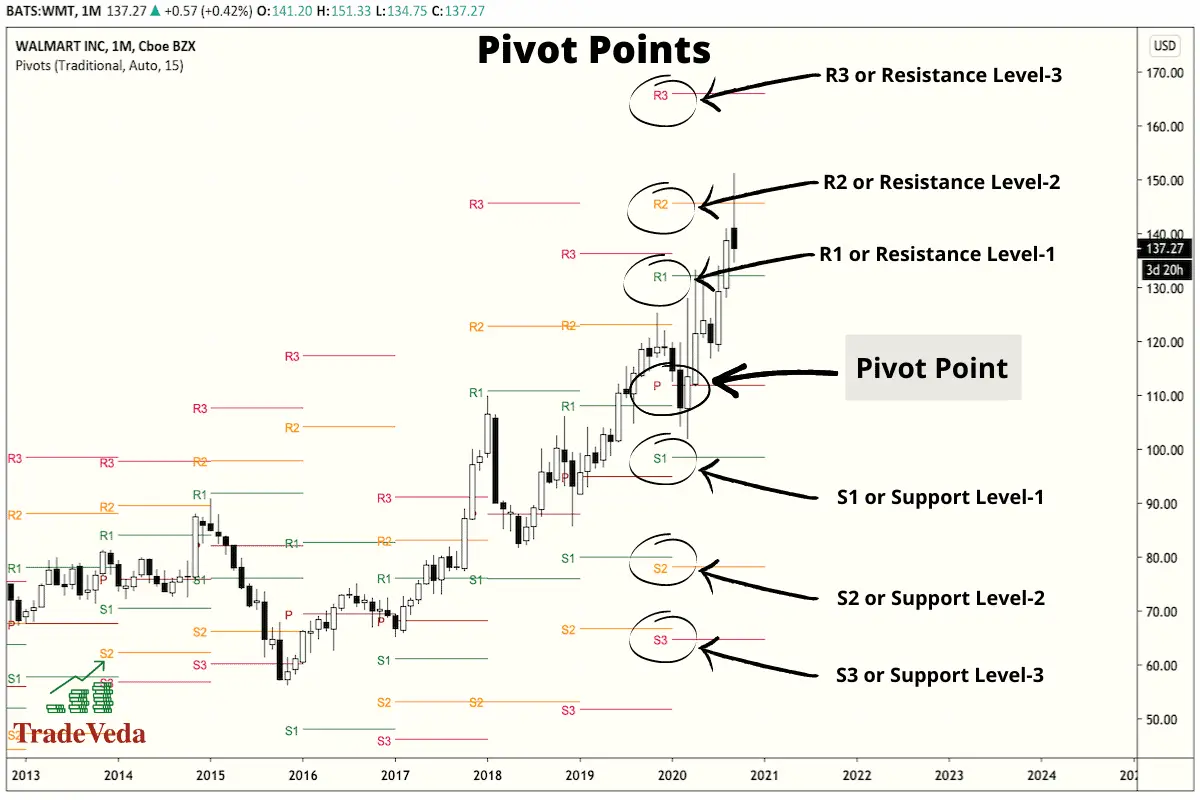
Pivot Points Indicator is a tool that provides an objective way to plot seven different Support and Resistance levels on the price chart of an asset. These Support and Resistance levels are meant to represent potential turning points within the market over a given period of time.
In a day trading situation, the seven pivot points will represent intraday turning points in the market.
There are several different variations of Pivot Point Indicators that you can deploy in your trading strategy. Each variation has its own strengths and weaknesses and the ideal choice of pivot point variation for you will depend on your trading conditions.
Six variations of Pivot Points that have been found to be effective in facilitating trading decisions are as follows –
- Standard Pivot Points
- Woodie Pivot Points
- Camarilla Pivot Points
- Fibonacci Pivot Points
- DeMark Pivot Points
- Floor Pivot Points
The calculations and the formulas for calculating each of the seven levels pivot levels will depend on the variation of the Pivot Point Indicator that you are using.
Trading with Pivot Points
- When the price of an asset is trading above the Pivot Point (PP), it indicates the day is positive, and conditions are conducive to buy.
- When the price is trading below the pivot point, it indicates that the day is negative for the asset that you are trading, and indicates that you might benefit from selling or short selling that asset.
- The additional Support and Resistance levels plotted by this indicator are used as potential points of reversal in trading the asset.
Advantages of Trading with Pivot Points
- Pivot Points provide traders with an objective method to identify Support and Resistance levels.
- Pivot Points are quick and easy to implement in day trading.
Limitations of Trading with Pivot Points
- Pivot Points can often provide false trading signals when used in isolation for making trading decisions.
- It is not uncommon for the price movement to fluctuate back and forth through a pivot level.
Fibonacci Retracements and Extensions
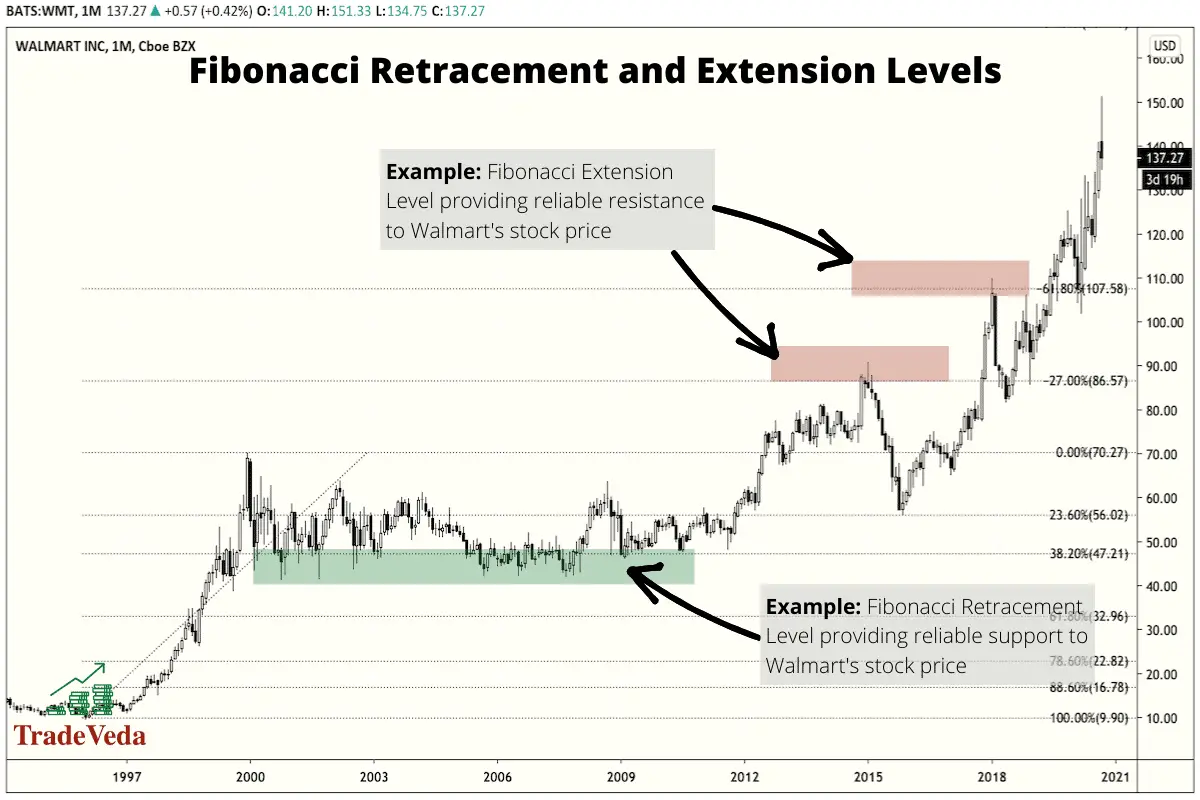
Fibonacci Retracement levels are horizontal lines, based on Fibonacci Ratios, that appear on a price chart. These lines indicate points where price reversal is likely to occur, and therefore provide traders with an objective way to identify Support and Resistance levels.
The “Fibonacci” here indicates that the lines are derived based on Fibonacci numbers, which are numbers forming a mathematical sequence where each number is based on the sum of the previous two numbers.
Most popular Fibonacci Retracement levels used in trading are 23.6%, 38.2%, 61.8% and 78.6%. 50% is not a Fibonacci ratio number, but it is also used commonly by most Fibonacci traders.
On the other hand, the Fibonacci Extensions levels are horizontal lines, based on Fibonacci Ratios, that provide traders with an objective way to establish take-profit targets. They can also be used to project how far a price may go after retracement or possible points where the price could reverse.
Popular Fibonacci Extension levels that are often used by technical traders include 61.8%, 100%, 161.8%, 200%, and 261.8%.
The primary difference between the Fibonacci Extension levels and the Fibonacci Retracement levels is that extensions show where the price will go after a retracement, while retracement levels show how deep the retracement could be.
Trading with Fibonacci Retracements and Extensions
- In an upward trending market, price pullback to a Fibonacci Retracement or Support level indicates an opportune time to buy the asset that you are trading.
- In a downward trending market, price pullback to a Fibonacci Retracement or Resistance Level indicates a good time to sell or short sell the asset that you are trading.
- As mentioned above, the Fibonacci Extension levels indicate high probability reversal points that you can use as take-profit and stop-loss levels.
Advantages of Trading with Fibonacci Retracements and Extension Levels
- Fibonacci Retracement and Extension levels provide traders with a tool to identify high probability reversal points that can be used to set trade-entry, take-profit, and stop-loss targets.
- The calculations for these levels are very objective and there is little to no subjectivity around them.
- Fibonacci Retracement and Extension levels are relatively easy and straightforward to incorporate in your trading strategy.
Limitations of Trading With Fibonacci Retracements and Extension Levels
- There is no guarantee that the price will actually stop and reverse from the support or resistance levels indicated by a Fibonacci Retracement.
- There are so many Fibonacci Retracement levels and the price could reverse at any one of them. Hence, it is challenging to know which of these levels will be useful at what time.
- There is no assurance that the price will reach a given Fibonacci Extension level.
- There is no guarantee that price will reverse at a given Fibonacci Extension level.
- Even if the price does reach/reverse as estimated, there is no way of determining which extension level will be important.
Parabolic SAR
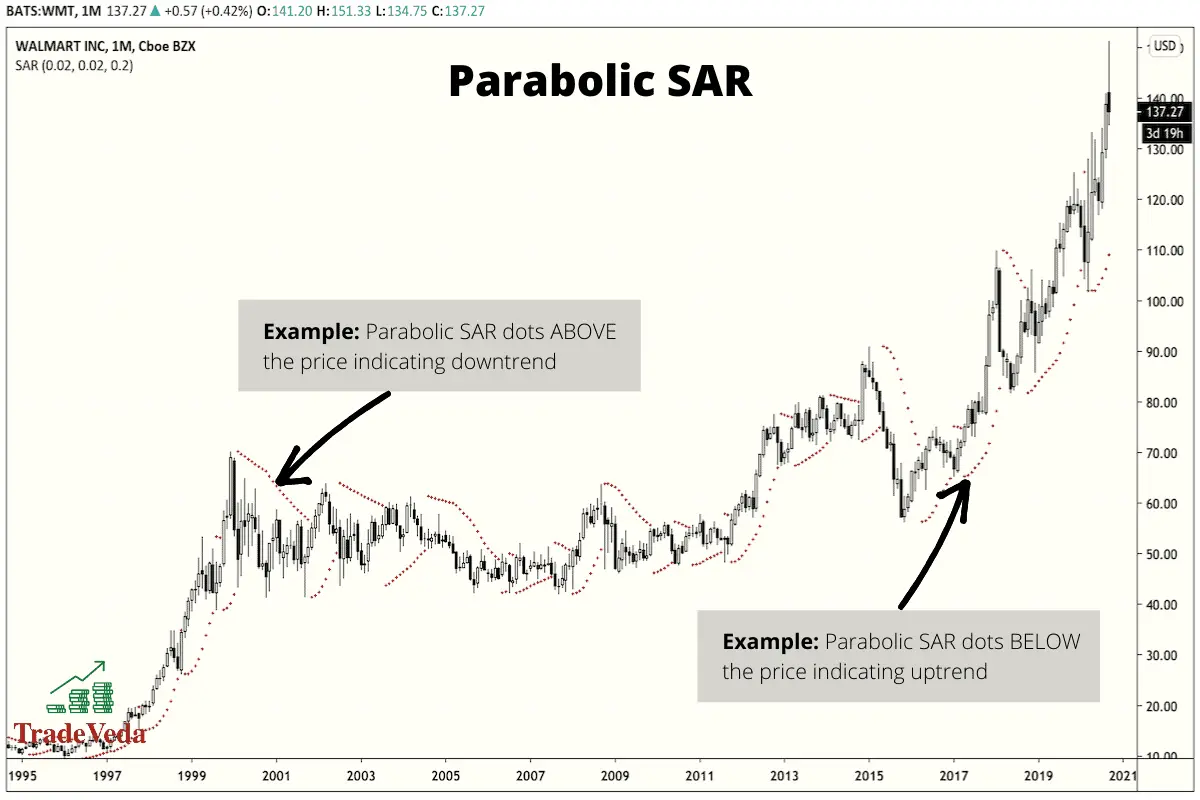
The Parabolic SAR is a price-and-time-based indicator used to determine the future short-term momentum of an asset. It trails behind price following its trend as it moves over time. So, the indicator highlights below price as it is rising and above price as it is declining.
The calculation of the SAR is a bit complicated, employing the use of if/then variables that are beyond the scope of this article, but the indicator formation can be broken down into two primary calculations. The first calculation determines the rising SAR and the second, the falling SAR.
The Parabolic SAR indicator allows traders to easily identify levels for the placement of stop orders (orders to stop or close a trade).
Trading with Parabolic SAR
- This indicator works with the assumption that a trader is fully committed to trade the asset being evaluated using Parabolic SAR.
- If the SAR is below the market price of the asset, you enter a long position when trading using this indicator.
- If the SAR is above the trading price of the asset, you enter a short sell position when trading using Parabolic SAR.
Advantages of Trading with Parabolic SAR
- Parabolic SAR is relatively simple to use and incorporate into your overall trading strategy.
- This indicator gives you very clear and unambiguous trading signals during both upward and downward trends.
Limitations of Trading with Parabolic SAR
- Without the assistance of trading software, a trader would need to have a thorough understanding of statistics and a few added things to be able to formulate the SAR or interpret the data points going into it.
- It is built for trending securities, and these only occur less than a third of the time. Based on data revealed by several studies, the trading results from using this indicator in non-trending assets has been less than impressive.
Moving Averages
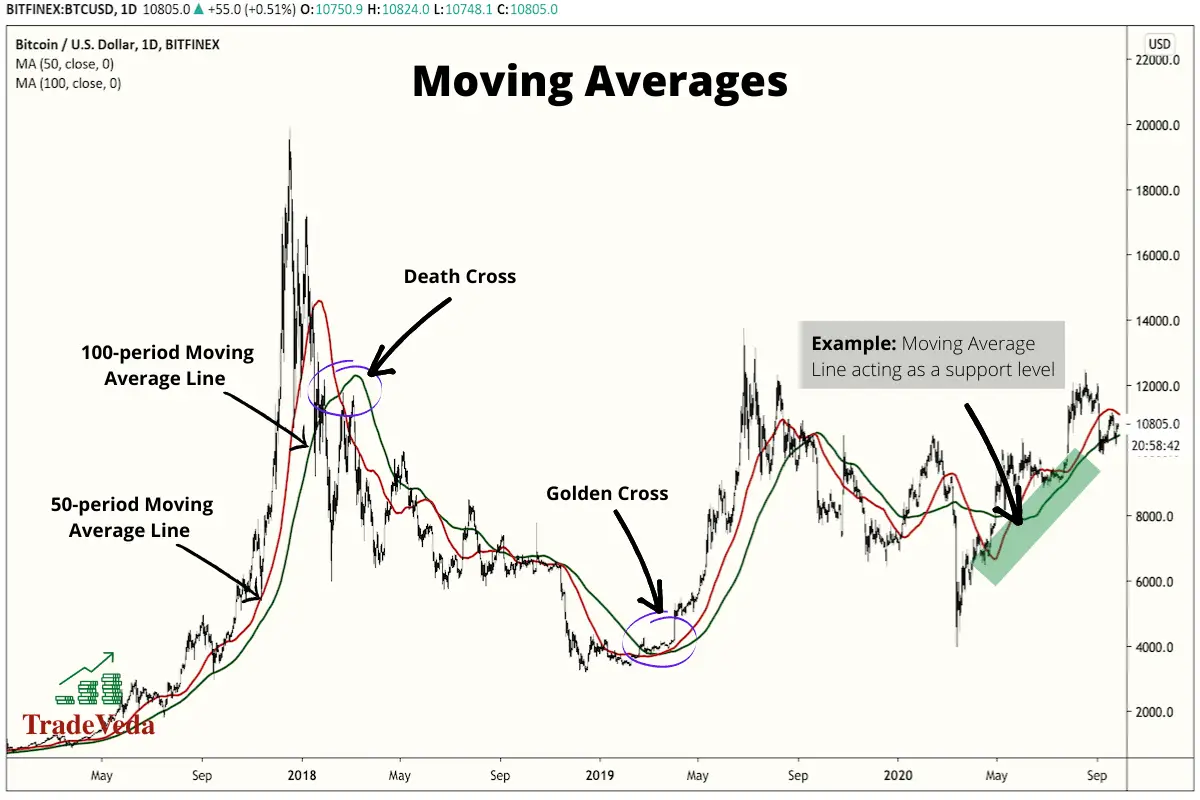
Moving Average (MA) is a metric that is used in trading as an indicator to measure the movement of price and to get an idea on the general direction of the trend over a specified period of time.
There are four basic types of moving averages that are commonly used in trading. These are:
- Simple weighted average
- Exponential-weighted moving average
- Linear moving average
- Smoothed moving average
Each moving average is a series of rolling averages, where the average calculated at each period is the weighted average of the closing price for a period of n relative to a current period.
While moving averages on their own are used as trading indicators, there is also a group of indicators based on moving average calculations. These derived indicators are often referred to as the Moving Average Indicators. Some of the most popular indicators in this group include Bollinger Bands, Donchian Channels, and Keltner Channels, which are all described in the following sections.
Trading with Moving Averages
Moving averages offer three main signals in trading. These are:
- When a Moving Average with a smaller period crosses a Moving Average with a larger period from beneath, it is called a golden cross and is an indication for traders to buy.
- When a Moving Average with a smaller period crosses a Moving Average with a larger period from above, it is a signal to sell. This is called a dead cross.
- Moving Averages can also be used as the Support and Resistance levels. If the price breaks above the Moving Average, it is a signal to buy the asset being analyzed. Similarly, if the price falls below the Moving Average instead, it signals to sell.
Advantages of Trading with Moving Averages
- Moving Averages are simple to identify, understand, and use in trading.
Limitations of Trading with Moving Averages
- Moving Averages give delayed signals because they are based on lagging information calculated from the last closing price.
MACD
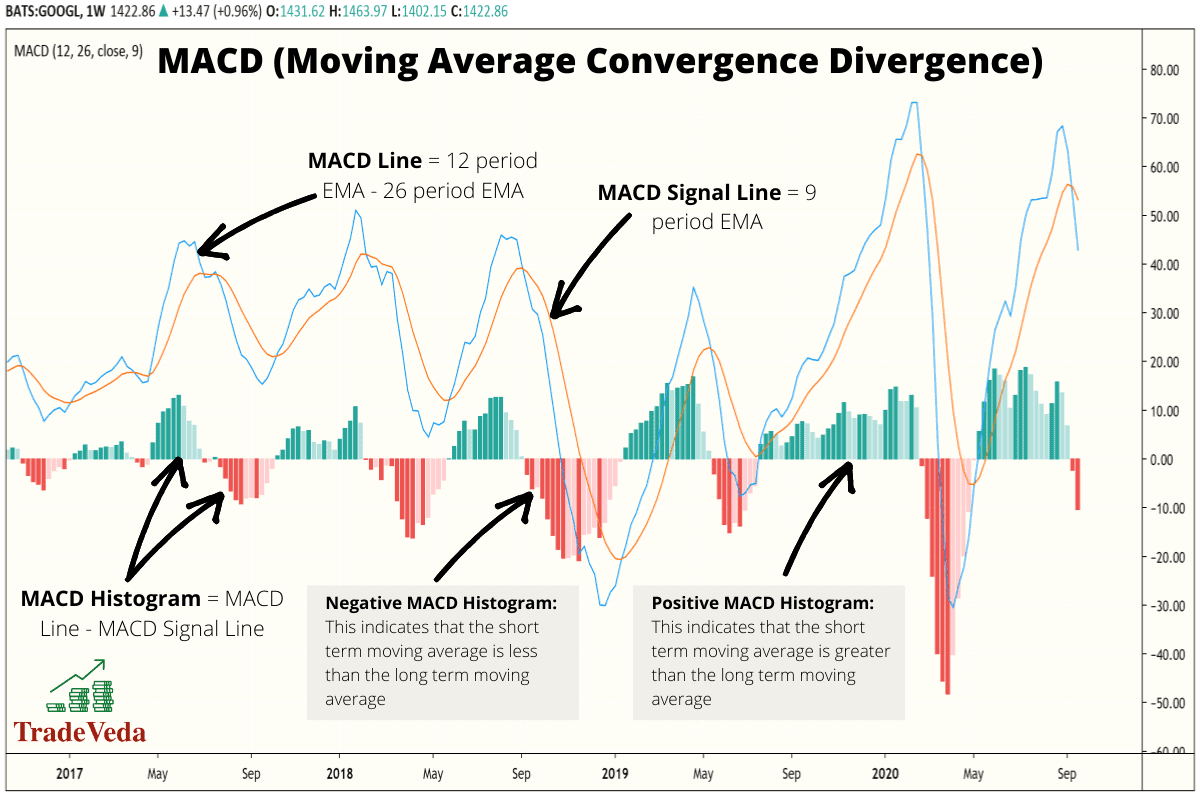
MACD stands for “Moving Average Convergence Divergence.” It is an indicator used to check the strength and direction of a trend and to determine the divergence in a price chart. Divergence is an advanced trading concepts and can, in turn, be used to identify price reversal zones.
MACD is calculated by subtracting the moving average for a longer-term period from the moving average for a shorter-term period. With these calculations, this indicator transforms the concept of Moving Average from being just being a trend indicator to being a momentum indicator. Unlike several other momentum indicators (such as – RSI, William %R, etc.), the MACD indicator has no limits but it does have a mean of 0.
When the two moving averages, used in indicator calculations, move towards each other, there is convergence. Similarly, when they move away from each other, divergence occurs.
Trading with MACD
- When the shorter moving average is below the longer moving average, the histogram is below 0. This is an indication to either sell or short sell; a downtrend is developing.
- When the shorter moving average is above the longer moving average, the histogram is above 0. This signals to buy as an uptrend is developing.
- You can also use the MACD as an oscillator to measure if a market is overbought or oversold and make trading decisions accordingly.
Advantages of Trading with MACD
- MACD can provide an early indication of reversal before it is confirmed by noting when the histogram crosses the 0 line.
- Trading signals from MACD are easily interpreted and can be easily incorporated into your overall trading strategy.
Limitations of Trading with MACD
- MACD in isolation can generate a series of false trading signals, resulting in unimpressive gains. Hence, it is important to use this indicator in combination with other concepts in technical analysis.
Bollinger Bands
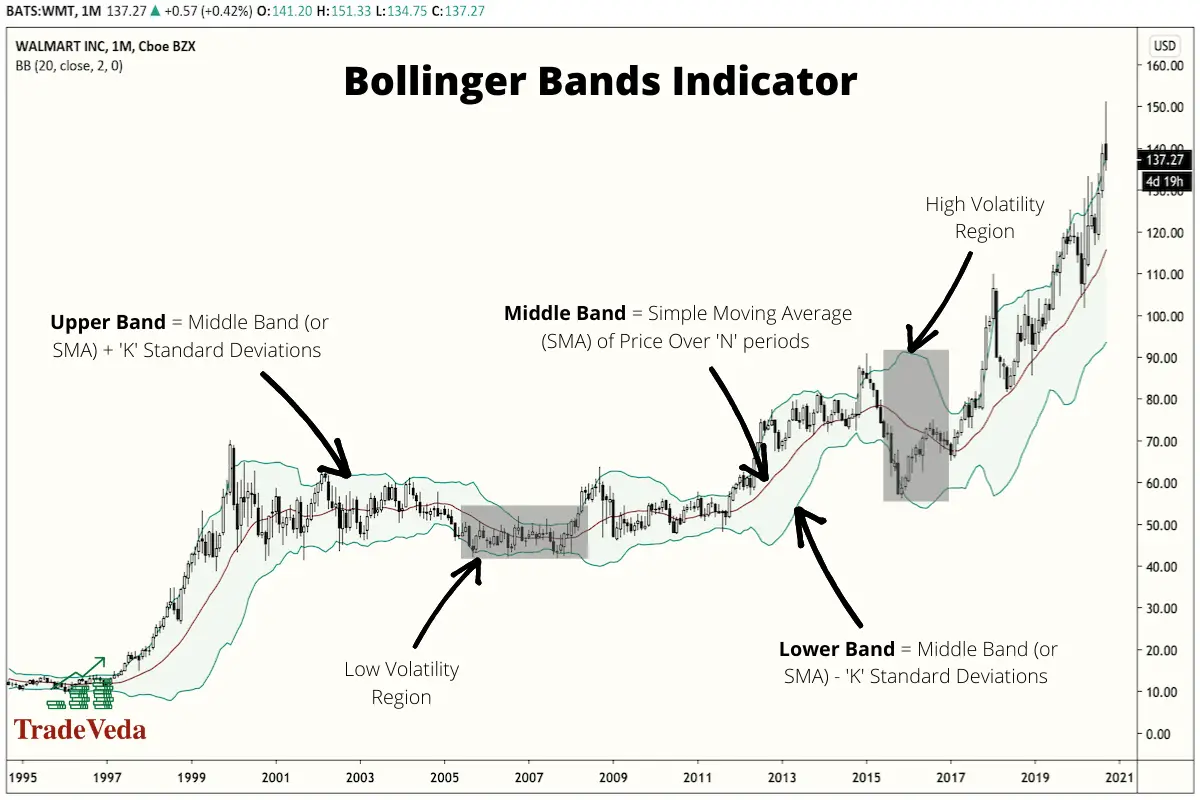
Bollinger Bands indicator is one of the most popular chart indicators used in technical trading. It is primarily used as a volatility indicator, but depending on your trading strategy, you can also use it as a momentum, a moving average, and a trend indicator.
The Bollinger Bands indicator is composed of three lines (also known as bands). These are –
- Middle Line or Band: The Middle Line plots the simple moving average (SMA), over a set duration of time, for the price of the asset being analyzed.
- Upper Line or Band: The Upper Line plots the price points that are 2 standard deviations (when using default indicator settings) above the simple moving average, represented by the Middle Line.
- Lower Line or Band: The Lower Line plots the price points that are 2 standard deviations (under default indicator settings) below the simple moving average, represented by the Middle Line.
In a more volatile market, the bands of this indicator expand away from each other. In contrast, in a less volatile market, they contract towards each other. The broadness or the width of the indicator can therefore be used as a signal for measuring the volatility of the market.
Notably, Bollinger bands are used to predict mean reversion in the market, though they are employed in identifying other types of trades as well. This means that traders anticipate with Bollinger Bands that anytime the price moves too far away either upwards or downwards from the mean (the middle band), it tends to revert back to the mean again. Per this ideology, traders look for patterns where the price is nearing a breakout from the mean and trade with the assumption that mean reversion will occur.
Trading with Bollinger Bands
- In an uptrend, when the price falls between the upper band and the middle band, it signals that the price is likely to continue the upward trajectory to the upper band. In these scenarios, you can take a buy trade, setting the middle band as your stop loss.
- In a downtrend, when the price falls between the lower band and the middle band, it signals that the price is likely to continue the downward trajectory to the lower band. In these scenarios, you can take a short sell trade, setting the middle band as your stop loss.
Advantages of Trading With Bollinger Bands
- Bollinger Bands are relatively effective in trading high volatility markets.
- They allow for early entry because they react quickly to market changes.
- They offer a suitable number of trading opportunities in fast-moving markets.
Limitations of Trading With Bollinger Bands
- Bollinger Bands are prone to offering false trading signals because they react quickly to price action.
- They are not the ideal indicator for a risk-averse trader.
Keltner Channels
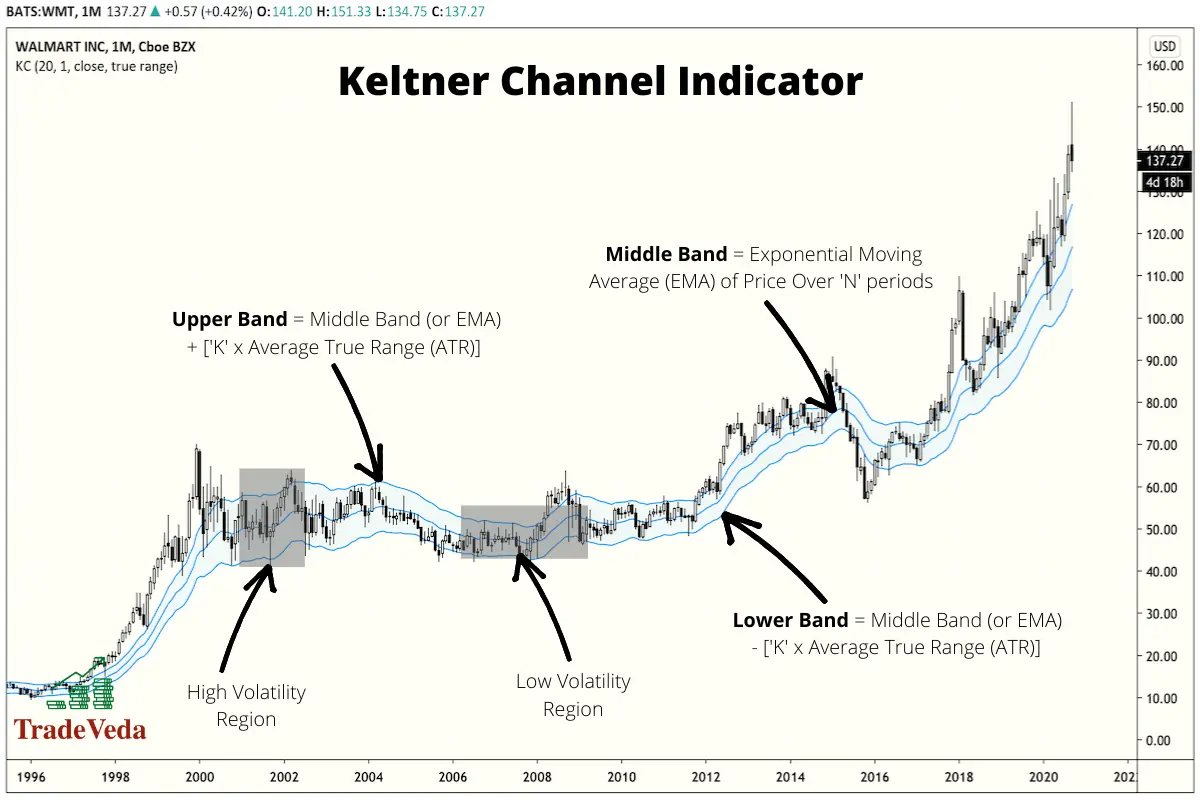
The Keltner Channel is another volatility-based technical indicator consisting of three lines. The middle line is a moving average of price for a period of n, where n is usually set to 20.
The moving average used in the calculation is by default an exponential moving average (EMA), but some traders may also use a simple moving average instead. The upper and lower channels are set a distance from the middle channel, similar to Bollinger bands, but the gap is calculated by multiplying 2 to the average true range from the middle line.
Trading with Keltner Channels
- In an uptrend, when the price falls between the middle channel and the upper channel, it is an indication that the price will continue to rise to the upper channel. In such scenarios, you can take a buy trade with the middle channel set as your stop loss.
- In a downtrend, when the price falls between the middle channel and the lower channel, it is an indication that the price will continue to fall to the lower channel. In such scenarios, you can take a short sell trade with the middle channel set as your stop loss.
- If the price breaks above the upper channel, it signals a potential bullish breakout. You can look for a bullish breakout trade after a confirmation signal in such scenarios. For such trades, the middle channel can serve as your stop-loss.
- Conversely, if the price breaks below the lower channel, it indicates a potential bearish breakout and signals you to look for a bearish breakout trade. Similar to the bullish breakout trades, you can use the middle channel as your stop loss target for these trades.
The pull-back strategy explained in the first two bullet points, and the breakout strategy, described in the third and the fourth bullet point, can also be used in conjunction with each other.
Advantages of Trading with Keltner Channels
- Keltner Channels indicator helps the trader make an objective measure of the market’s volatility and current trend.
- It is relatively easy to identify potential breakout trades, pull-back trades, and trend reversals using this indicator.
- When trading with Keltner Channels, it is possible to get in and out of the trade quickly using scalping techniques.
Limitations of Trading with Keltner Channels
- Keltner Channels do not indicate market changes as quickly as other moving-average based indicators, such as Bollinger Bands, do. This is because this indicator leverages the true average range in the upper and the lower channel calculations.
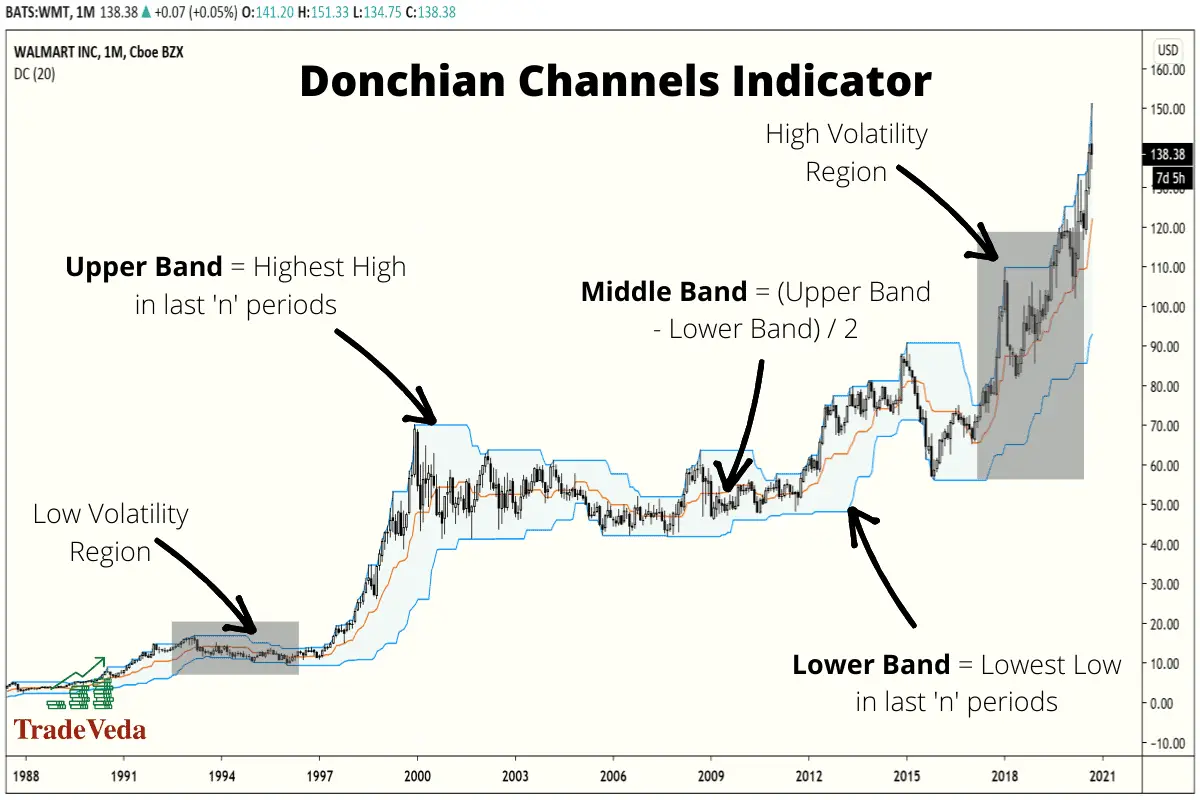
Donchian Channel
The Donchian Channel indicator is a trend indicator. Much like the other indicators in its group, it is composed of three lines calculated from moving averages. The upper band marks the highest high, and the lower band marks the lowest low in the price of a security over n periods. Then, the middle band is a midpoint between the upper and lower bands for n periods.
Trading with Donchian Channel
- A breakout above the upper band of the Donchian Channel is a buy signal with the upper band as your stop-loss point.
- A breakout below the lower band of the Donchian Channel is a sell signal, or a signal to short, with the lower band as you stop-loss target.
- When price crosses the middle band from the bottom towards the upper band, it is a signal to buy, setting the lower band as your stop-loss target.
- When the price crosses the middle band from the top towards the lower band, it is a signal to either sell or short sell the security, setting the upper band as your stop-loss target.
- When the market falls to its lower channel, with the mean aversion strategy, it is a signal to buy and close when the market rallies above the middle channel.
- When the market rises to its upper channel, with the mean aversion strategy, it is a signal to sell or short sell the security and to close your trade for profit when the market rallies below the middle channel.
Advantages of Trading with Donchian Channels
- They are an excellent choice for the risk-averse trader.
- They give reliable information on low volatility stocks.
- They can be effectively used for trading in a market that is choppy and difficult to attach to a trend.
Limitations of Trading with Donchian Channels
- They do not include the current price information of an asset.
- They are not designed to deal with highly volatile assets.
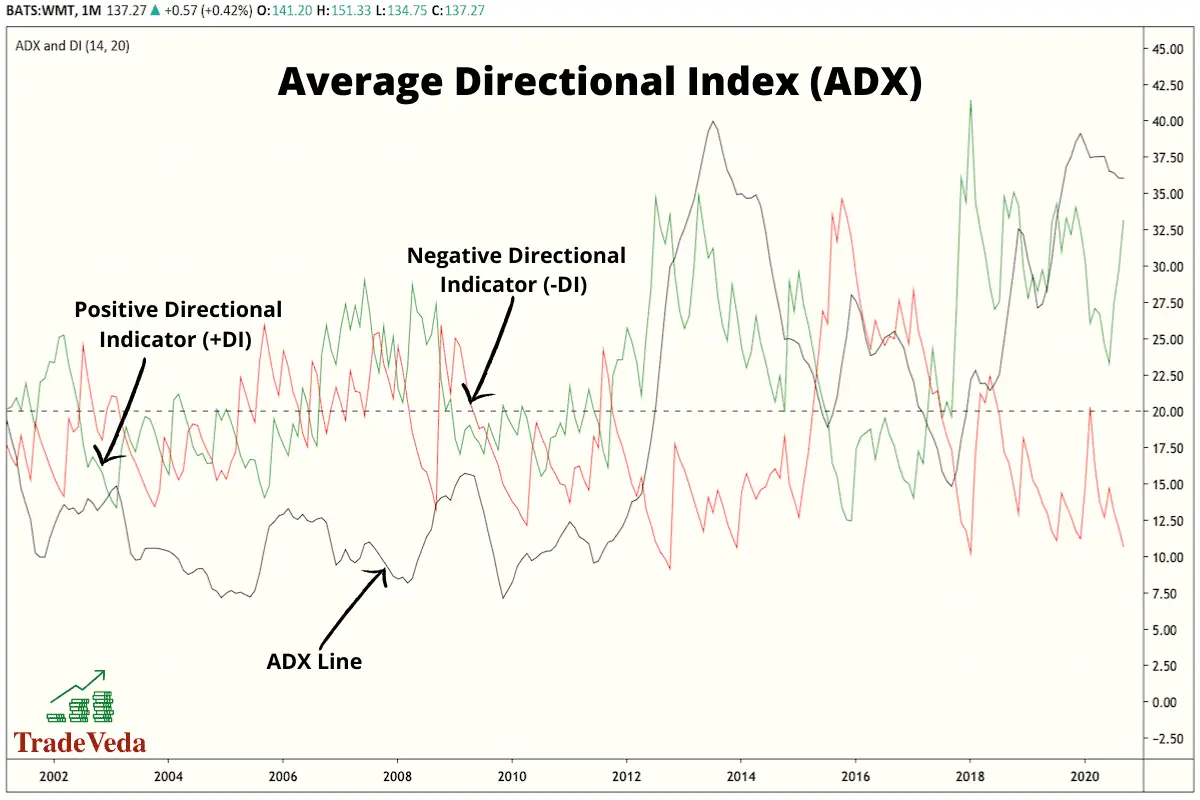
ADX (Average Directional Index)
The average directional index is another moving average trend indicator that is primarily used to determine the trend’s strength, either up or down. It is usually accompanied by two other lines making it a three lines plot on the price chart, where the ADX is the middle line.
Often, the upper line shows the Positive Directional Indicator (+DI) and the lower line shows the Negative Directional Indicator (-DI).
The ADX itself helps investors to determine the strength of a trend movement, whereas the accompanying +DI and -DI help to show the direction of the trend and aid in making trading decisions.
Trading with ADX (Average Directional Index)
- If the +DI line crosses above the -DI line and the ADX is above 20 (ideally 25), it can be taken as a buy signal.
- If the -DI crosses above the +DI and the ADX is above 20 or 25, it can be taken as a signal to either sell or short sell the asset.
- When ADX is below 20, this signals that price is currently trendless, and it is not a good time for position trading.
Advantages of Trading with ADX (Average Directional Index)
- This indicator is straightforward and easy to interpret.
- It shows both the trend direction and trend strength.
Limitations of Trading with ADX (Average Directional Index)
- False signaling occurs: Crossovers between the +DI and -DI can frequently occur, often too frequently, resulting in confusion and potential loss. (This is more common when ADX <25.)
- Sometimes the ADX will rise above 25, but only be there temporarily. This is another false signal that ADX generates that could result in losses.
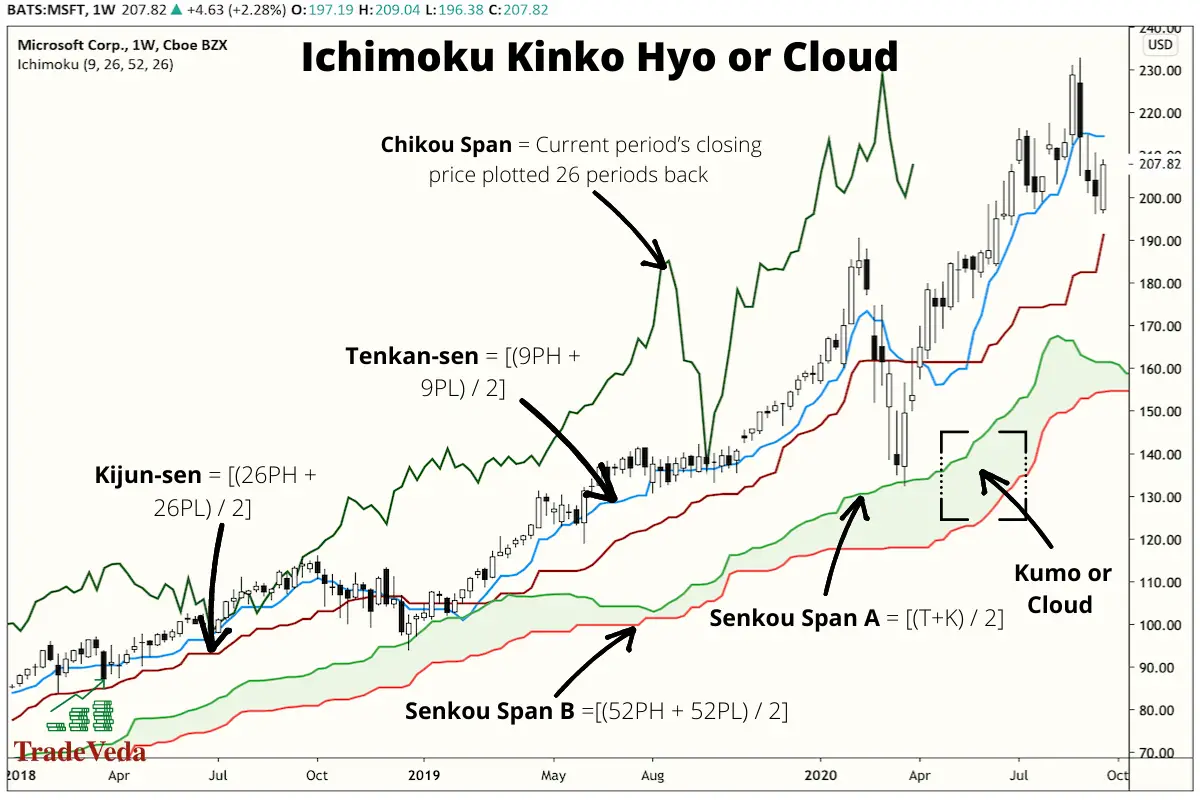
Ichimoku Kinko Hyo or Cloud
This indicator is a combination of various technical trading strategies and is designed to provide traders with an easy way and a one-stop-shop to interpret the momentum, the support, and the resistance on a price chart.
The Japanese word “Ichimoku” translates to “one look,” again emphasizing that this indicator is meant to be easy to use. The Ichimoku Kinko Hyo can be broken down into five main components explained below:
- A conversion line called Tenkan-sen is calculated by adding the highest high and the highest low over the past nine periods and then dividing by 2.
- A baseline called the Kijun-sen is calculated by adding the lowest low and highest high over 26 periods and then dividing the result by two.
- The Senkou Span A, or the “the leading span A,” forms one edge of the “cloud” (Kumo) and is calculated by adding the tenkan-sen and kijun-sen and dividing by two. The result is then plotted 26 periods ahead.
- Senkou Span B, or “leading span B” is formed by adding the highest high and lowest low over for the past 52 periods, then dividing by 2. The result is plotted 26 periods ahead.
- Chikou Span or the “lagging span” takes the current period’s closing price and plots it back 26 days on the chart to show possible areas of support and resistance.
The Ichimoku Indicator uses averages, but they vary a bit from moving average calculations. The calculations of the Ichimoku Indicator take sums of highs and low over a period divided by two, whereas a standard moving average finds the average closing price over a period. One is not superior to the other; they are just different.
Trading with Ichimoku Kinko Hyo or Cloud
This indicator shows you:
- An overall uptrend when the price is above the cloud, a downtrend when the price is below the cloud, and a transition when the price is within the cloud.
- When leading span A is crossing leading span B from bottom-up, similar to a golden cross with moving averages, it is a buy signal.
- When leading span A is crossing leading span B from top-down, similar to a dead cross with moving averages, it is a signal to sell.
- Traders sometimes use the indicator to measure support and resistance for the current period and future predictions and then trade based on projections on the movement of price.
- If the conversion line moves above the baseline, this is also a powerful buy signal. A trader may choose to hold the trade until the conversion line drops back below the baseline, but any of the other lines can also be used as exits.
Advantages of Trading with Ichimoku Kinko Hyo or Cloud
- This indicator displays a relatively more precise picture because it shows more data points.
- It combines the best indicators into one chart.
- It allows for more informed decision-making.
- It can be used in almost every market type.
- It helps you to take advantage of false breakouts because it catches price-action in real-time.
Limitations of Trading with Ichimoku Kinko Hyo or Cloud
- It can make a chart look busy with all the lines involved.
- Since it is based on historical data, there is nothing in the future that is innately predictive.
- The indicator can become irrelevant for long periods where the price ends up running way above or below it.
Author’s Recommendations: Top Trading and Investment Resources To Consider
Before concluding this article, I wanted to share few trading and investment resources that I have vetted, with the help of 50+ consistently profitable traders, for you. I am confident that you will greatly benefit in your trading journey by considering one or more of these resources.
- Roadmap to Becoming a Consistently Profitable Trader: I surveyed 5000+ traders (and interviewed 50+ profitable traders) to create the best possible step by step trading guide for you. Read my article: ‘7 Proven Steps To Profitable Trading’ to learn about my findings from surveying 5000+ traders, and to learn how these learnings can be leveraged to your advantage.
- Best Broker For Trading Success: I reviewed 15+ brokers and discussed my findings with 50+ consistently profitable traders. Post all that assessment, the best all round broker that our collective minds picked was M1 Finance. If you are looking to open a brokerage account, choose M1 Finance. You just cannot go wrong with it! Click Here To Sign Up for M1 Finance Today!
- Best Trading Courses You Can Take For Free (or at extremely low cost): I reviewed 30+ trading courses to recommend you the best resource, and found Trading Strategies in Emerging Markets Specialization on Coursera to beat every other course on the market. Plus, if you complete this course within 7 days, it will cost you nothing and will be absolutely free! Click Here To Sign Up Today! (If you don’t find this course valuable, you can cancel anytime within the 7 days trial period and pay nothing.)
- Best Passive Investment Platform For Exponential (Potentially) Returns: By enabling passive investments into a Bitcoin ETF, Acorns gives you the best opportunity to make exponential returns on your passive investments. Plus, Acorns is currently offering a $15 bonus for simply singing up to their platform – so that is one opportunity you don’t want to miss! (assuming you are interested in this platform). Click Here To Get $15 Bonus By Signing Up For Acorns Today! (It will take you less than 5 mins to sign up, and it is totally worth it.)
Conclusion
This article broke down 13 useful indicators that you can employ in a technical trading plan. Different indicators have different sets of advantages and disadvantages, and accordingly, they are better or less suited for a particular trading condition.
With a fair understanding of the key strengths and weaknesses of each indicator type, you can better determine the most reliable indicator for your individual trading needs. However, for the best result, you should always incorporate a combination of complementary technical indicators into your overall trading strategy.
BEFORE YOU GO: Don’t forget to check out my latest article – ‘Exploring Social Trading: Community, Profit, and Collaboration’. I surveyed 1500+ traders to identify the impact social trading can have on your trading performance, and shared all my findings in this article. No matter where you are in your trading journey today, I am confident that you will find this article helpful!
Affiliate Disclosure: We participate in several affiliate programs and may be compensated if you make a purchase using our referral link, at no additional cost to you. You can, however, trust the integrity of our recommendation. Affiliate programs exist even for products that we are not recommending. We only choose to recommend you the products that we actually believe in.
Recent Posts
Exploring Social Trading: Community, Profit, and Collaboration
Have you ever wondered about the potential of social trading? Well, that curiosity led me on a fascinating journey of surveying over 1500 traders. The aim? To understand if being part of a trading...
Ah, wine investment! A tantalizing topic that piques the curiosity of many. A complex, yet alluring world where passions and profits intertwine. But, is it a good idea? In this article, we'll uncork...
